In this 1 hour technical analysis of Celestia (TIA USDT), we will examine key support and resistance levels, Fibonacci retracement levels, demand zones and fair value gaps that may provide insight on potential near term price action. Let’s begin by taking a closer look at the identified levels.
1 Hour Timeframe Analysis
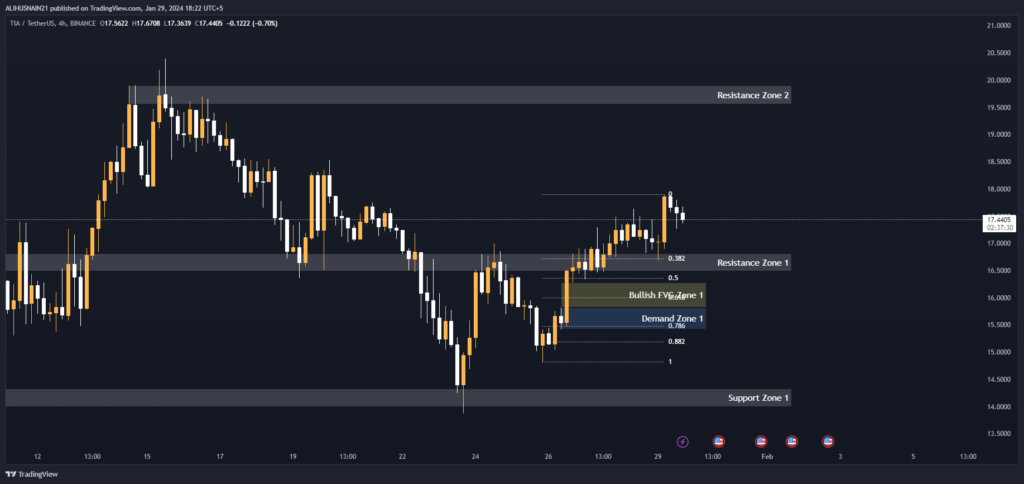
The 1 hour TIA USDT chart shows evolving short-term technical structure. Sellers look to be defending the $16.8382 region while buyers eye a break above $17.4377 resistance. The confluent Demand Zone and bullish FVG zone between $17.0488-$16.6881 provide an appealing risk defined long entry if price pulls back to this pocket of underlying support.
Maintaining a multi-time frame approach considering daily/weekly trends will also be important. Overall, the immediate term setup remains neutral with a bearish bias until the $16.8382 level is clearly recaptured to the upside.
Support and Resistance Levels
As seen in the table, the current price is finding resistance just above the key Support Zone 1 between $16.8382-$16.6861. This zone lines up with a cluster of recent lows, making it an area where sellers may look to enter shorts if resistance holds.
A break below this support could see further weakness towards the next support level.
| S / R Type | High | Low |
| Support Zone 1 | 16.8382 | 16.6861 |
Fibonacci Retracement Levels
Fibonacci retracement levels show potential pullback targets for traders looking to enter based on retracements of the recent advance. The 0.382 level at $17.4377 currently poses resistance.
A break above this could see a retest of the 0.50 level at $17.2942. Support levels to watch for potential long entries would be the 0.618 and 0.786 levels.
| 0.382 | 17.4377 |
| 0.50 | 17.2942 |
| 0.618 | 17.1507 |
| 0.786 | 16.9468 |
| 0.882 | 16.6882 |
Demand Zone
The Demand Zone between $17.0488-$16.6881 encompasses the Support Zone 1 and aligns with peaks that previously acted as resistance, making it an area where buying interest may step in. This zone could offer an attractive risk/reward if tested on further weakness.
| Zone Number | High | Low |
| Demand Zone 1 | 17.0488 | 16.6881 |
Fair Value Gaps / Imbalances
The bullish Fair Value Gap/Imbalance zone between $17.1409-$17.0488 shows an area of relatively thin trading activity where buying interest may emerge to fill the void on a retest.
This lines up with underlying support outlined by the key Demand Zone and makes for a high probability long entry if reached.
| Gap Number | High | Low |
| Bullish FVG Zone 1 | 17.1409 | 17.0488 |