Current XAI USDT price is 0.8617. In this technical analysis, I will analyze the 4-hour and 1-hour timeframes to identify potential support, resistance, supply and demand zones as well as Fibonacci retracement levels that could impact future price movement.
4 Hour Timeframe
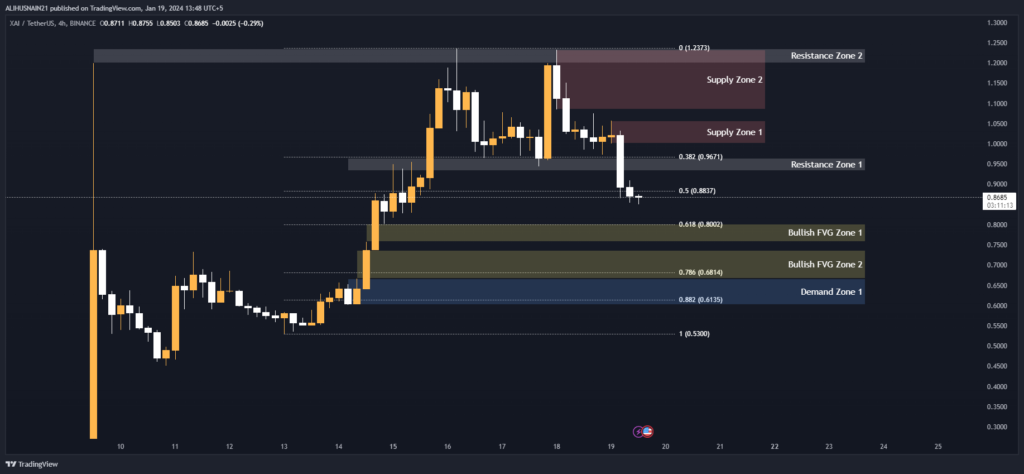
The 4-hour chart gives us a good overview of the mid-term trends and levels. Currently, XAI USDT is in a downtrend after facing rejection at Resistance Zone 1 of 0.9654-0.9326. Strong resistance also exists in Zone 2 of 1.2360-1.2000. On the downside, price is finding support at Demand Zone 1 of 0.6673-0.6011.
Looking at Fibonacci retracement levels, the 38.2% level of 0.9671 and 50% level of 0.8837 have now become resistance. Support lies at the 61.8% level of 0.8002 and below. If price breaks below this, it could fall to the 78.6% level of 0.6814 and 0.882 level.
Supply zones have formed at 1.0577-1.0014 and 1.2329-1.0847 as price rallied previously. These zones could now act as resistance if tested.
Two bullish fair value gap zones exist at 0.8021-0.7584 and 0.7377-0.6673. If price stage a rebound from current levels, these gaps could act as magnets and halt future corrections.
Support and Resistance Levels
| S / R Type | High | Low |
| Resistance Zone 1 | 0.9654 | 0.9326 |
| Resistance Zone 2 | 1.2360 | 1.2000 |
Fibonacci Retracement Levels
| 0.382 | 0.9671 |
| 0.50 | 0.8837 |
| 0.618 | 0.8002 |
| 0.786 | 0.6814 |
| 0.882 | 0.6135 |
Supply Zone
| Zone Number | High | Low |
| Supply Zone 1 | 1.0577 | 1.0014 |
| Supply Zone 2 | 1.2329 | 1.0847 |
Demand Zone
| Zone Number | High | Low |
| Demand Zone 1 | 0.6673 | 0.6011 |
Fair Value Gaps / Imbalances
| Gap Number | High | Low |
| Bullish FVG Zone 1 | 0.8021 | 0.7584 |
| Bullish FVG Zone 2 | 0.7377 | 0.6673 |
1 Hour Timeframe
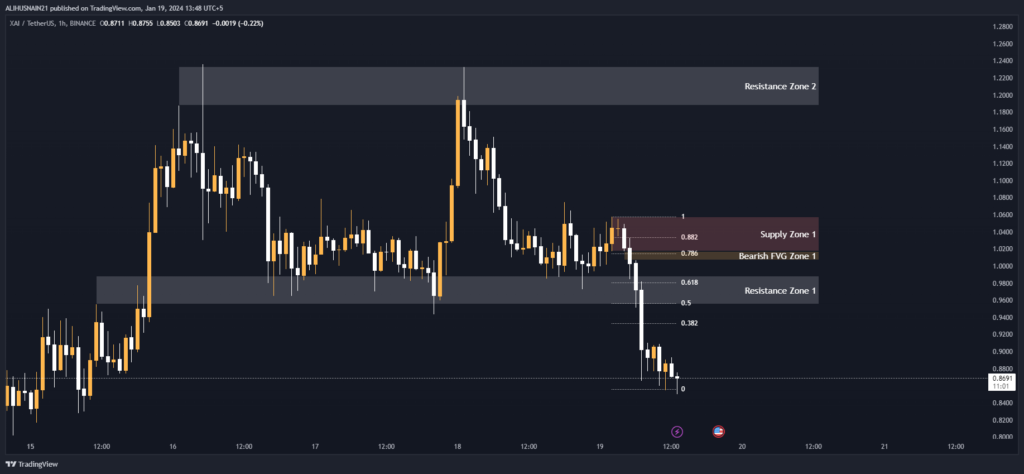
Zooming into the 1-hour chart, we see Resistance Zones 1 and 2 formed at 0.9883-0.9550 and 1.2333-1.1874 respectively. The 38.2%, 50% and 61.8% Fibonacci retracement levels also provide resistance at 0.9331, 0.9566 and 0.9806. Support lies below these levels.
A supply zone has formed between 1.0577-1.0173 which could act as resistance.
Interestingly, a bearish fair value gap zone exists from 1.0175-1.0067. If price drops, it could find resting support within this zone before potentially resuming its downtrend.
Support and Resistance Levels
| S / R Type | High | Low |
| Resistance Zone 1 | 0.9883 | 0.9550 |
| Resistance Zone 2 | 1.2333 | 1.1874 |
Fibonacci Retracement Levels
| 0.382 | 0.9331 |
| 0.50 | 0.9566 |
| 0.618 | 0.9806 |
| 0.786 | 1.0147 |
| 0.882 | 1.0338 |
Supply Zone
| Zone Number | High | Low |
| Supply Zone 1 | 1.0577 | 1.0173 |
Fair Value Gaps / Imbalances
| Gap Number | High | Low |
| Bearish FVG Zone 1 | 1.0175 | 1.0067 |
In summary, on the 4-hour chart, XAI USDT remains in a downtrend amid resistance at 0.95-1.23 zone. Support exists at 0.66-0.80.
On the 1-hour chart, resistance and supply zones form barriers between 0.95-1.05. A bearish gap offers support between 1.01-1.00. Support for a potential bounce is present on both timeframes.