XAI USDT is currently trading at $0.7604, XAI USDT finds itself in between key support and resistance zones on the 4-hour chart.
To determine the likely near-term direction, we will examine structural levels, momentum indicators, and order flow signals.
On the 1-hour timeframe, price action is testing immediate support near the 0.618 Fib retracement level.
A break below this could see a move towards the next demand zone, while a bounce signals possible rallies to resistance.
The current consolidation phase between key support and resistance zones signals indecision in the XAI USDT market. Bears require a break below $0.7998 to gain traction and target lower levels.
Bulls need strong upside momentum and volume to surmount resisting supply above $0.9326. Near-term direction likely depends on which side of the $0.7998 price closes on over the next few hours/days of trade.
4 Hour Timeframe
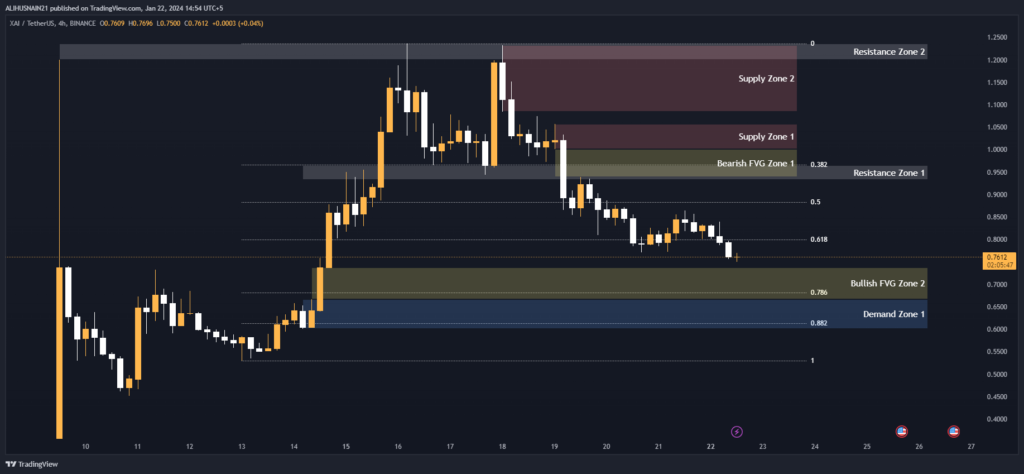
On the 4-hour chart, XAI USDT is sandwiched between the 0.618 Fib retracement level at $0.7998 below and Resistance Zone 1 between $0.9654 – $0.9326 above.
This zone between $0.7998-$0.9326 represents a resistance cluster where selling pressure is likely to pick up on any rallies. Above this, Resistance Zone 2 at $1.2360 – $1.2000 will be difficult to surmount in the near-term without a clear shift in momentum.
To the downside, support lies at the 0.618 level and Demand Zone 1 between $0.6673- $0.6011. A breakdown below $0.6011 could see an acceleration lower to test Supply Zone 1 at $1.0577- $1.0014 or the bottom of Bearish Fair Value Gap Zone 1 between $1.0014- $0.9388. This region between $0.7998 to $0.6011 is where the next significant direction decision will occur.
Momentum on the 4-hour is neutral to bearish below the -0.618% range, giving some cause for caution on new long entries at the moment. Bulls require a strong push above key resistance at $0.9326-$0.9654 to spark a rally towards higher targeted supply between $1.0577- $1.2329.
Support and Resistance Levels
| S / R Type | High | Low |
| Resistance Zone 1 | 0.9654 | 0.9326 |
| Resistance Zone 2 | 1.2360 | 1.2000 |
Fibonacci Retracement Levels
| 0.382 | 0.9665 |
| 0.50 | 0.8829 |
| 0.618 | 0.7998 |
| 0.786 | 0.6811 |
| 0.882 | 0.6128 |
Supply Zone
| Zone Number | High | Low |
| Supply Zone 1 | 1.0577 | 1.0014 |
| Supply Zone 2 | 1.2329 | 1.0847 |
Demand Zone
| Zone Number | High | Low |
| Demand Zone 1 | 0.6673 | 0.6011 |
Fair Value Gaps / Imbalances
| Gap Number | High | Low |
| Bearish FVG Zone 1 | 1.0014 | 0.9388 |
| Bullish FVG Zone 2 | 0.7377 | 0.6673 |
1 Hour Timeframe
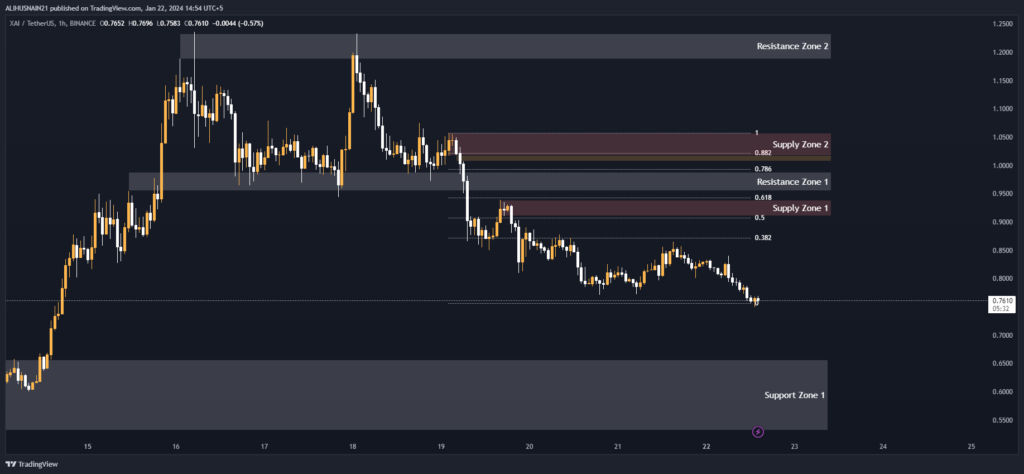
Zooming into the 1-hour chart, we can see price is currently trading around the 0.618 Fib level at $0.7604 after finding support at $0.6567 yesterday. Nearby support lies at the 0.50 Fib level ($0.8829) before Demand Zone 1. Momentum remains weak here with the RSI below 50 and no bullish divergence formed on the latest swing low.
Any breakdown below $0.7998 on increasing volume could see further selling towards $0.6673 initial demand. However, holding the 0.618 level and forming higher lows signals ongoing appetite for dips and potential higher initiatives towards Resistance Zone 1 from $0.9550- $0.9883. A close above here opens the path to retest Supply Zone 1 at $0.9388 – $0.9100 and Resistance Zone 2 beyond $1.1874.
Support and Resistance Levels
| S / R Type | High | Low |
| Resistance Zone 1 | 0.9883 | 0.9550 |
| Resistance Zone 2 | 1.2333 | 1.1874 |
| Support Zone 1 | 0.6567 | 0.5314 |
Fibonacci Retracement Levels
| 0.382 | 0.8717 |
| 0.50 | 0.9074 |
| 0.618 | 0.9425 |
| 0.786 | 0.9935 |
| 0.882 | 1.0220 |
Supply Zone
| Zone Number | High | Low |
| Supply Zone 1 | 0.9388 | 0.9100 |
| Supply Zone 2 | 1.0577 | 1.0173 |
Fair Value Gaps / Imbalances
| Gap Number | High | Low |
| Bearish FVG Zone 1 | 1.0175 | 1.0067 |