In the near-term XAI USDT, holding above $0.7 could lead to further recoveries back toward the 1-hour resistance levels. However, breaks below Support Zone 1 or Demand Zone 1 may indicate the current rebound has ended.
4 Hour Timeframe
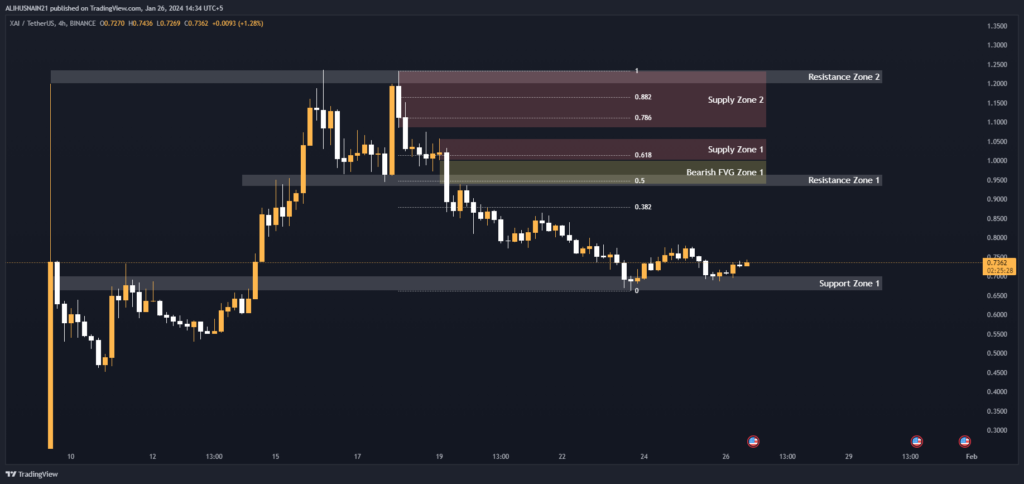
On the 4-hour timeframe the overall trend remains bearish as long as XAI USDT is trading below Resistance Zone 1. Breaks below Support Zone 1 or filling of the bearish FVG could see further downside tests of the lower support levels.
Support and Resistance Levels
On the 4-hour chart XAI USDT, we can see there are three notable support zones and two resistance zones that will be important to watch:
- Support Zone 1 – $0.7015 to $0.6613. Breaking below this level could mean further downside is likely.
- Resistance Zone 1 – $0.9654 to $0.9326. A break above here could signal a trend reversal to the upside.
- Resistance Zone 2 – $1.2360 to $1.2000. Breaking above this zone is needed to confirm the uptrend is intact long-term.
| S / R Type | High | Low |
| Support Zone 1 | 0.7015 | 0.6613 |
| Resistance Zone 1 | 0.9654 | 0.9326 |
| Resistance Zone 2 | 1.2360 | 1.2000 |
Fibonacci Retracement Levels
Fib retracement levels give us key upside price targets if the trend reverses from the current levels:
| 0.382 | 0.8794 |
| 0.50 | 0.9473 |
| 0.618 | 1.0147 |
| 0.786 | 1.1105 |
| 0.882 | 1.1656 |
A break above the 0.618 level would be a strong sign the downtrend is over on this timeframe.
Supply Zone
The supply zones indicate areas where sell pressure may increase again if prices approach:
| Zone Number | High | Low |
| Supply Zone 1 | 1.0577 | 1.0014 |
| Supply Zone 2 | 1.2329 | 1.0847 |
Breaking below Supply Zone 1 could lead to another leg down.
Fair Value Gaps / Imbalances
This bearish fair value gap (FVG) between $0.9388-1.0014 hints more downside may unfold if it is not filled:
| Gap Number | High | Low |
| Bearish FVG Zone 1 | 0.9388 | 1.0014 |
Filling this gap could result in a brief relief rally before the next move lower.
1 Hour Timeframe
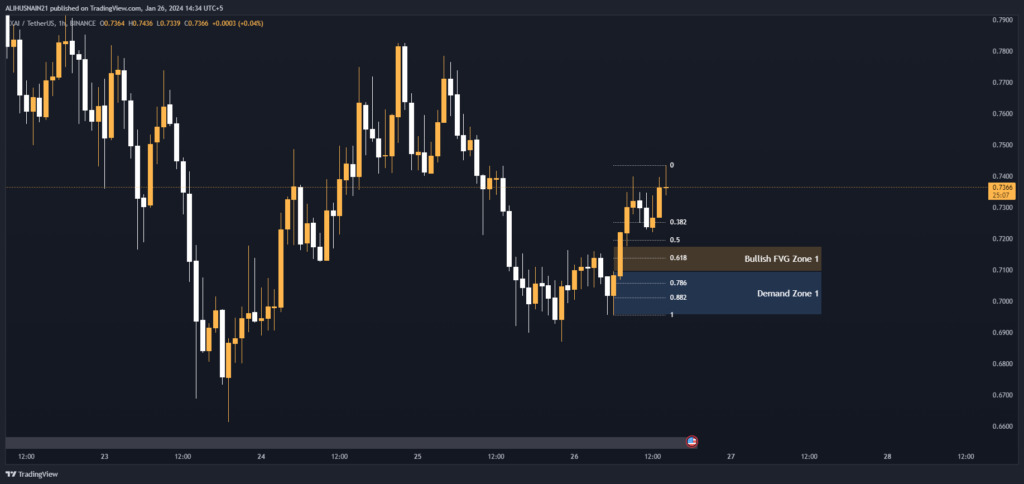
In the 1-hour timeframe XAI USDT is showing signs of a potential short-term recovery within its broader downtrend.
The next few days will be important to see if sustained breaks above Resistance Zone 1 can occur. Otherwise, retests of the lower support levels are still on the cards.
Zooming into the 1-hour chart of XAI USDT provides a closer look at the short-term structure:
Support and Resistance Levels
- Resistance Zone 1 – $0.9883 to $0.9550 will need to be overcome to see upside continuation.
- Resistance Zone 2 – $1.2333 to $1.1874 is the next key hurdle above Resistance Zone 1.
- Support Zone 1 – $0.6567 to $0.5314. Holding above here maintains the prospect of further recovery.
| S / R Type | High | Low |
| Resistance Zone 1 | 0.9883 | 0.9550 |
| Resistance Zone 2 | 1.2333 | 1.1874 |
| Support Zone 1 | 0.6567 | 0.5314 |
Fibonacci Retracement Levels
The 0.382 and 0.50 levels have now provided temporary support, with the next levels to watch being:
| 0.382 | 0.7230 |
| 0.50 | 0.7178 |
| 0.618 | 0.7126 |
| 0.786 | 0.7052 |
| 0.882 | 0.7007 |
Demand Zone
This demand zone between $0.7096-0.6956 could provide an area of support if retested:
| Zone Number | High | Low |
| Demand Zone 1 | 0.7096 | 0.6956 |
Fair Value Gaps / Imbalances
The bullish gap from $0.7176-0.7096 suggests the current bounce still has potential fuel if that zone is defended:
| Gap Number | High | Low |
| Bullish FVG Zone 1 | 0.7176 | 0.7096 |