The technical indicators on the 4 hour and 1 hour timeframes suggest XAI USDT is in an overall upside channel against the USDT in the short term. Support and demand zones provide low risk entry opportunities, while resistance levels and gap zones signify potential profit targets. Downside risks emerge only on a break below the key $0.6567 support level.
XAI USDT is currently trading around $0.8456 on the charts. Let’s analyze the key support and resistance levels, as well as Fibonacci retracement levels and imbalance zones to gauge the trend and potential reversal areas.
4 Hour Timeframe Analysis
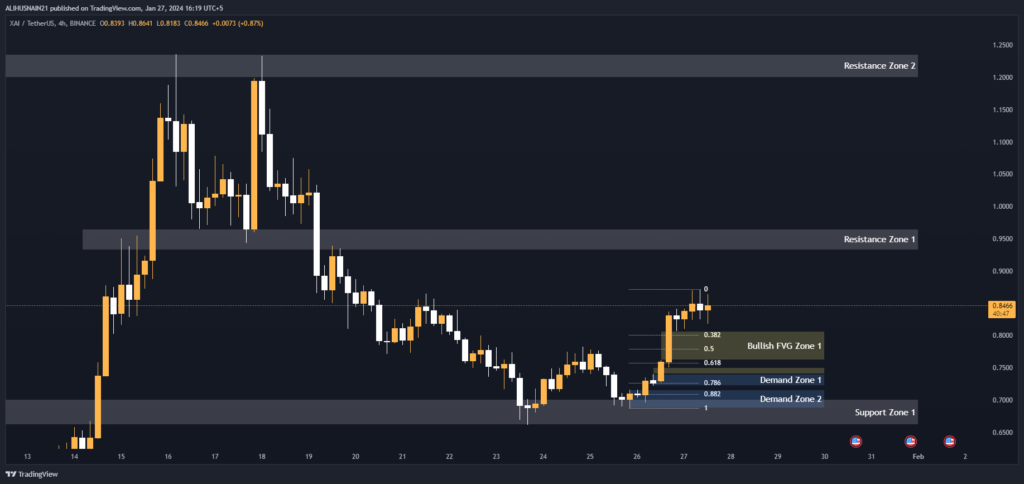
The 4 hour analysis points to potential further upside if XAI USDT price breaks above $0.9326 resistance. A bounce off the $0.7015 support would maintain the short term bullish structure. Downside risks increase on a break below $0.6613 support.
Support and Resistance Levels
There is strong support for XAI USDT is between $0.7015-0.6613. This zone aligns with the 0.618 and 0.786 Fibonacci retracement levels of 0.7792 and 0.7265 respectively. Breaking below this key support could signify a bearish trend.
The first resistance zone is between $0.9654-0.9326, in line with the 0.382 Fibonacci level of 0.8010. A break above this resistance would confirm an upside continuation.
| S / R Type | High | Low |
| Support Zone 1 | 0.7015 | 0.6613 |
| Resistance Zone 1 | 0.9654 | 0.9326 |
Fibonacci Retracement Levels
| 0.382 | 0.8010 |
| 0.50 | 0.7792 |
| 0.618 | 0.7792 |
| 0.786 | 0.7265 |
| 0.882 | 0.7087 |
Demand Zone
Examining the demand zones, we see potential low volatility buying opportunities between $0.7399-0.7221 and $0.7163-0.6870.
| Zone Number | High | Low |
| Demand Zone 1 | 0.7399 | 0.7221 |
| Demand Zone 2 | 0.7163 | 0.6870 |
Fair Value Gaps / Imbalances
The bullish fair value gaps from $0.8066-0.7621 and $0.7505-0.7399 indicate accumulation zones where buying pressure may emerge to fill the gaps.
| Gap Number | High | Low |
| Bullish FVG Zone 1 | 0.8066 | 0.7621 |
| Bullish FVG Zone 2 | 0.7505 | 0.7399 |
1 Hour Timeframe Analysis
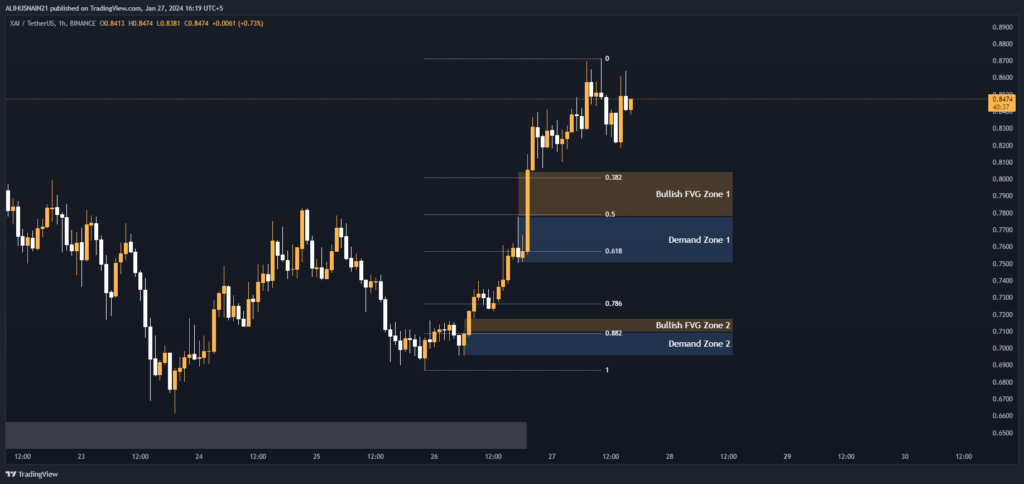
In the 1 hour time frame of XAI USDT, the support and resistance levels are tighter. First support is at $0.6567-0.5314. Below this, the trend would turn bearish. Resistance lies at $0.9883-0.9550. Breaking above this opens the path to the next resistance zone of $1.2333-1.1874.
Fibonacci retracement mirrors the 4 hour levels. The demand zones from $0.7777-0.7505 and $0.7096-0.6956 indicate potential low risk entry areas.
The bullish fair value gaps between $0.8045-0.7777 and $0.7176-0.7096 point to upside continuation if prices rise to fill these gaps.
Support and Resistance Levels
| S / R Type | High | Low |
| Support Zone 1 | 0.6567 | 0.5314 |
| Resistance Zone 1 | 0.9883 | 0.9550 |
| Resistance Zone 2 | 1.2333 | 1.1874 |
Fibonacci Retracement Levels
| 0.382 | 0.8011 |
| 0.50 | 0.7789 |
| 0.618 | 0.7572 |
| 0.786 | 0.7266 |
| 0.882 | 0.7088 |
Demand Zone
| Zone Number | High | Low |
| Demand Zone 1 | 0.7777 | 0.7505 |
| Demand Zone 2 | 0.7096 | 0.6956 |
Fair Value Gaps / Imbalances
| Gap Number | High | Low |
| Bullish FVG Zone 1 | 0.8045 | 0.7777 |
| Bullish FVG Zone 2 | 0.7176 | 0.7096 |
XAI USDT 1 hour analysis points to potential upside moves targeting $0.9550 and $1.1874 resistance levels in the near term, with support at $0.6567.
A drop below this support would invalidate the short term bullish outlook. Demand zones and gaps provide potential low risk entry points to benefit from further uptrend moves.