In this analysis, I will be taking a look at the technical factors influencing the short term price action of XAI USDT over a 1 hour timeframe. The current price is $0.8509.
In the 1 hour technical picture of XAI USDT, bearish signals from indicators are corroborated by weaker price action over the past hours. Downside appears to be the more likely scenario in the near term with key support at $0.8150.
However, a bounce from demand zone 1 could present a potential short term sell opportunity. Traders may look to enter short on a break below $0.8150 or a retest of resistance levels for further downside.
1 Hour Timeframe
Support and Resistance Levels
Identifying key support and resistance zones is crucial for determining the likely near term price direction and trading opportunities. As we can see from the table above, the nearest support zone sits between $0.8243 – $0.8150.
If price of XAI USDT breaks below this level, we could see further selling pressure driving price lower toward the next support at $0.8150. On the upside, resistance is seen between $0.8765 – $0.8672. A break above this level could result in a test of the major resistance at $0.8765.
| S / R Type | High | Low |
| Support Zone | 0.8243 | 0.8150 |
| Resistance Zone | 0.8765 | 0.86720 |
Fibonacci Retracement Levels
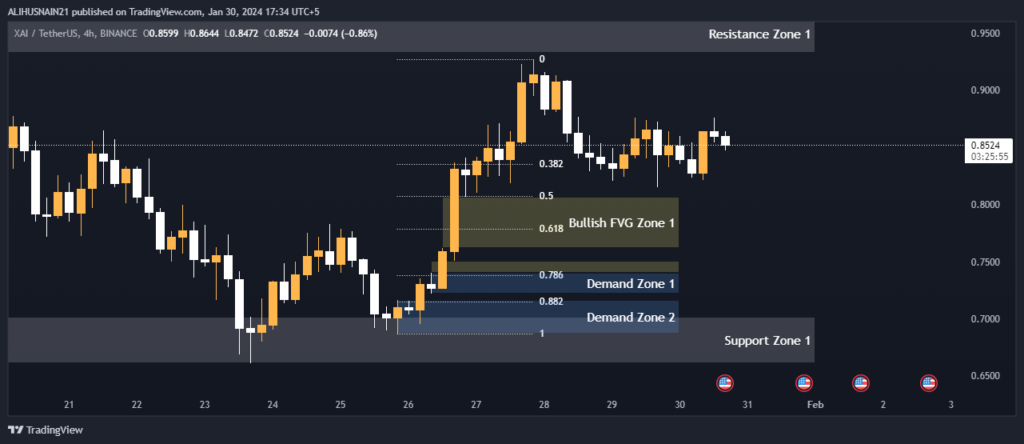
Fibonacci retracement levels provide us with potential pullback levels that price may reach after a significant move. As seen in the table, the first retracement level of 0.382 sits at $0.8538, closely followed by the 0.5 level at $0.8476.
These levels should now act as resistance if reached. However, a break below the 0.618 level of $0.8414 could signal the downtrend is set to resume.
| 0.382 | 0.8538 |
| 0.50 | 0.8476 |
| 0.618 | 0.8414 |
| 0.786 | 0.8324 |
| 0.882 | 0.8273 |
Demand Zone
Demand zones represent areas of increased demand, where buyers tend to step in as price pulls back. Looking at the chart, we can identify demand zone 1 between $0.8325 – $0.8211 as the strongest concentration of previous support and resistance.
A bounce from this zone could present a buying opportunity.
| Zone Number | High | Low |
| Demand Zone 1 | 0.8325 | 0.8211 |
Candlestick Patterns on XAI USDT
Examining the hourly candlestick patterns, we can see a bearish engulfing candle formed over the past two hours on the back of lower trading volumes. This suggests sellers are currently in control and price may test further support levels.
Additionally, the downward sloping stochastic on the oversold region implies there is scope for more downside.
Moving Averages on XAI USDT
All short term moving averages (8, 21, 50 EMA) are fanned out in bearish configuration and price is trading well below them, indicating the short term trend remains down.
The 8 EMA currently sits around $0.8570 and could provide resistance on any bounce in the near term.
MACD Indicator on XAI USDT
The MACD (Moving Average Convergence Divergence) shows decreasing momentum and its signal line is about to cut below the MACD, which is a bearish sign.
This coincides with the bearish candlestick formation and could mean downside momentum is picking up in the short term.