The 4 hour and 1 hour timeframes indicate XAI is currently in an uptrend, with rising support provided by the $0.75 level on weekly and $0.90 level on daily.
The 4 hour and 1 hour charts show the ascending channel structure in more detail, with support found at $0.97 and $0.98 respectively.
With higher lows and lows being formed consistently across all timeframes, the trend remains bullish. Immediate resistance lies at $1.12, with further resistance and potential trend continuation above $1.20-1.23.
A break of support levels would signal a potential trend reversal. On the upside, if resistance breaks, the next key price target area lies in the supply zone between $1.20-1.23.
4 Hour Timeframe
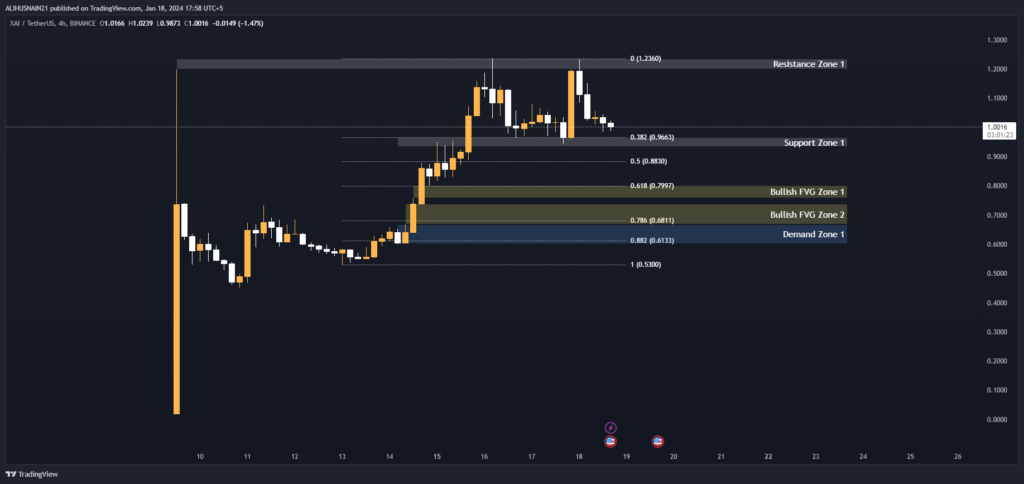
On the 4 hour chart, we can see the market structure in greater detail. XAI has formed multiple higher lows and higher highs within an ascending channel since bottoming in late November.
Recent support was found at the confluence of the 38.2% Fibonacci retracement level and the bottom trendline of the channel at $0.97. Immediate resistance is seen at $1.12, with further resistance and the all time high at $1.23-1.20.
Above the all time high, additional resistance is seen in the supply zone between $1.23-1.20. Below current support at $0.97, additional support lies in the demand zone between $0.66-0.60.
A break of either the upper or lower channel trendlines would signal a change in trend direction on this timeframe.
Support and Resistance Levels
| S / R Type | High | Low |
| Resistance Zone 1 | 1.2360 | 1.2000 |
| Support Zone 1 | 0.9654 | 0.9326 |
Fibonacci Retracement Levels
| 0.382 | 0.9663 |
| 0.50 | 0.8830 |
| 0.618 | 0.7997 |
| 0.786 | 0.6811 |
| 0.882 | 0.6133 |
Demand Zone
| Zone Number | High | Low |
| Demand Zone 1 | 0.6673 | 0.6011 |
Fair Value Gaps / Imbalances
| Gap Number | High | Low |
| Bullish FVG Zone 1 | 0.8021 | 0.7584 |
| Bullish FVG Zone 2 | 0.7377 | 0.6673 |
1 Hour Timeframe
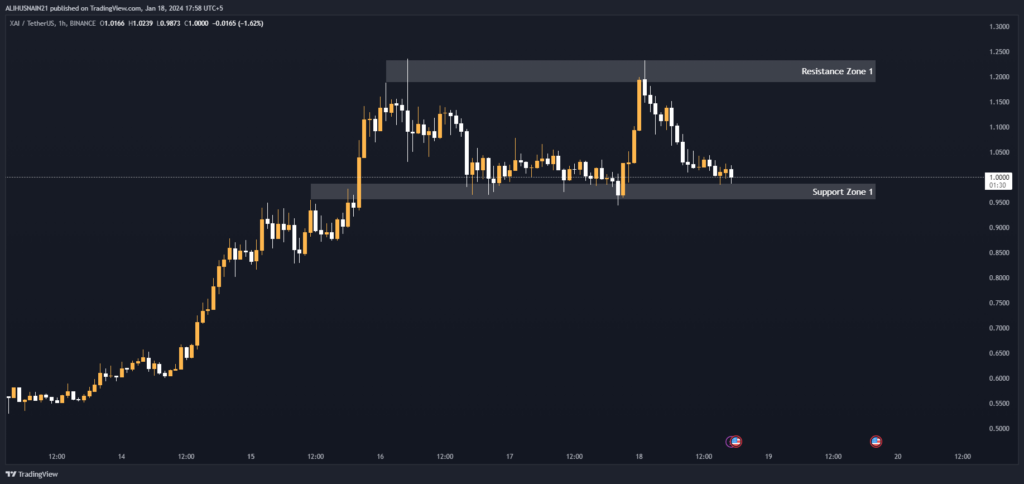
On the 1 hour chart, XAI is currently in an uptrend forming higher highs and higher lows within an ascending channel. It has bounced repeatedly off support at the $0.98 level, provided by the 50% Fibonacci retracement and the bottom trendline of the channel.
Immediate resistance lies at $1.12, with another resistance level found at the confluence of the 100% Fibonacci extension and the upper trendline of the channel between $1.19-1.23.
A break above $1.23 could see further upside towards the supply zone at $1.20-1.23 mentioned on the 4 hour timeframe.
Alternatively, a break below $0.98 would signal a potential trend reversal to the downside on this timeframe, with support seen next at $0.95.
Support and Resistance Levels
| S / R Type | High | Low |
| Support Zone 1 | 0.9883 | 0.9550 |
| Resistance Zone 1 | 1.2338 | 1.1880 |