XRP USDT is consolidating after facing rejection from resistance on lower timeframes. The path of least resistance seems skewed to the downside for now unless buyers can muster strength to breach interim barriers. Traders may wait for cues of short-term momentum picking up on hourly candles before entering fresh positions. Upside opens up on a potential 4HR close above $0.5359.
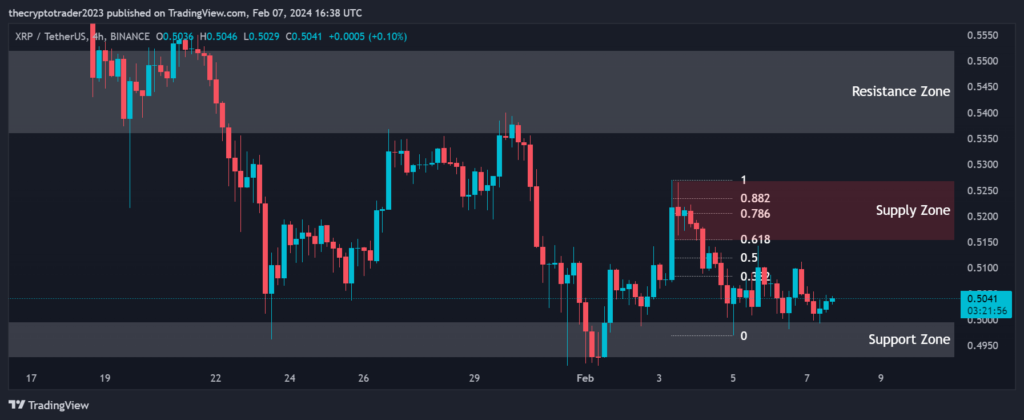
On the 4-hour chart, XRP USDT finds itself trading between support at $0.4997-$0.4927 and resistance at $0.5522-$0.5359. The price is currently testing the 0.382 Fibonacci retracement level of $0.5084 as support. A break below this level could see it drop towards the 0.50 level at $0.5120, with support expected around $0.4927. Alternatively, a rise above current resistance could see it test the 0.618 level at $0.5155 and potentially the 0.786 level at $0.5205. The supply zone between $0.5153-$0.5270 overlaps with these resistance levels and its breach will act as a bullish sign.
Support and Resistance Levels
S / R Type
High
Low
Support Zone
0.4997
0.4927
Resistance Zone
0.5522
0.5359
Fibonacci Retracement Levels
0.382
0.5084
0.50
0.5120
0.618
0.5155
0.786
0.5205
0.882
0.5234
Supply Zone
Zone Number
High
Low
Supply Zone
0.5153
0.5270
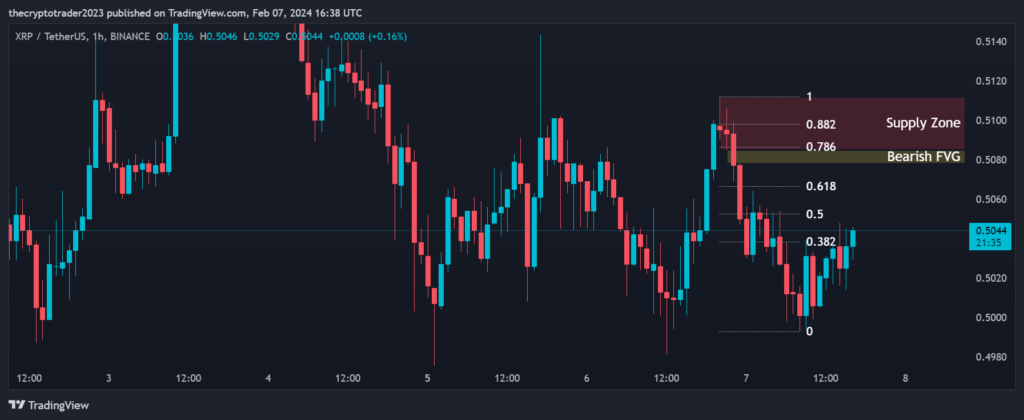
1 Hour Timeframe
On the 1-hour scale, the crypto has found support at the supply zone of $0.5085-$0.5112 after briefly dropping to fill the bearish fair value gap (BFVG) from $0.5085-$0.5078. However, upside seems capped by the resistance cluster formed by the 0.382, 0.50 and 0.618 Fibonacci retracement levels at $0.5038, $0.5052 and $0.5067 respectively. A firm break above $0.5112 is needed to negate near-term bearish pressure and allow a rise towards the 0.786 and 0.882 levels at $0.5087 and $0.5098. Alternatively, weakness below $0.5078 could trigger another leg lower.