Arbitrum (ARB USDT) appears to be in an overall uptrend based on the higher lows being formed on the 4-hour chart. The current price of 2.0427 is above important support levels and moving averages, providing a bullish technical bias.
The price holding below key support levels and moving averages, the technical bias remains long term bullish above 1.9040 invalidation level. The first upside target is the long target at 2.1716, with resistance at 2.1055-2.0710 zone to clear first. On further strength, a break above the Volume Profile high could see larger gains materialize.
ARB USDT Technical Analysis
Support Levels
Strong support exists at 1.9167-1.8822 from Support Zone 1. Further downside support lies at 1.6666-1.6239 within Support Zone 2. These support levels need to hold to keep the short-term uptrend intact.
| Support Zone Number | Price High | Price Low |
| Support Zone 1 | 1.8822 | 1.9167 |
| Support Zone 2 | 1.6239 | 1.6666 |
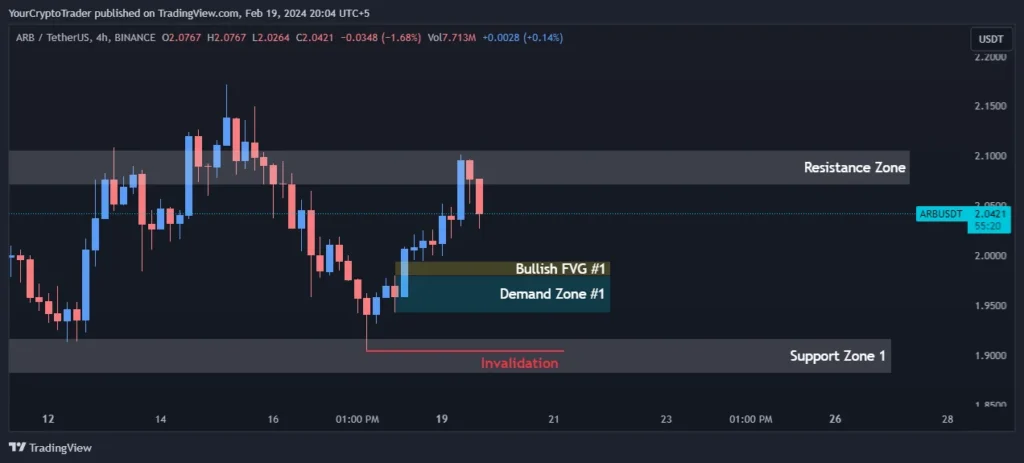
Resistance Levels
Resistance is seen at 2.1055-2.0710 within the Resistance Zone. A break above this level could lead to further upside.
| Resistance Zone Number | Price High | Price Low |
| Resistance Zone | 2.0710 | 2.1055 |
Fibonacci Retracement Levels
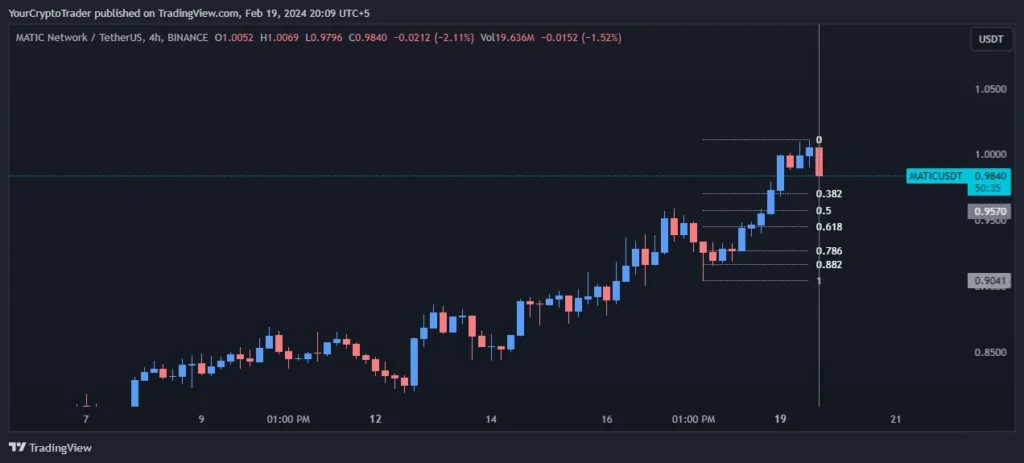
We see potential bounce areas between 0.382-0.886 Fib retracement levels of 2.0260-1.9275. A hold above 0.618 level of 1.9793 would maintain an upward bias.
| Fib Retracement Value | Price |
| 0.382 Fib Level | 2.0260 |
| 0.50 Fib Level | 2.0023 |
| 0.618 Fib Level | 1.9793 |
| 0.786 Fib Level | 1.9465 |
| 0.882 Fib Level | 1.9275 |
Demand Zones
Increased demand could emerge on a dip towards the 1.9430-1.9796 demand zone, as volume typically picks up in these areas.
| Demand Zone Number | Price High | Price Low |
| Demand Zone | 1.9796 | 1.9430 |
Fair Value Gaps / Imbalances (FVG)
Bullish price action may develop towards filling the 1.9940-1.9796 gap area.
| FVG Zone Number | Price High | Price Low |
| Bullish FVG | 1.9940 | 1.9796 |
Exponential Moving Averages (EMA) Levels
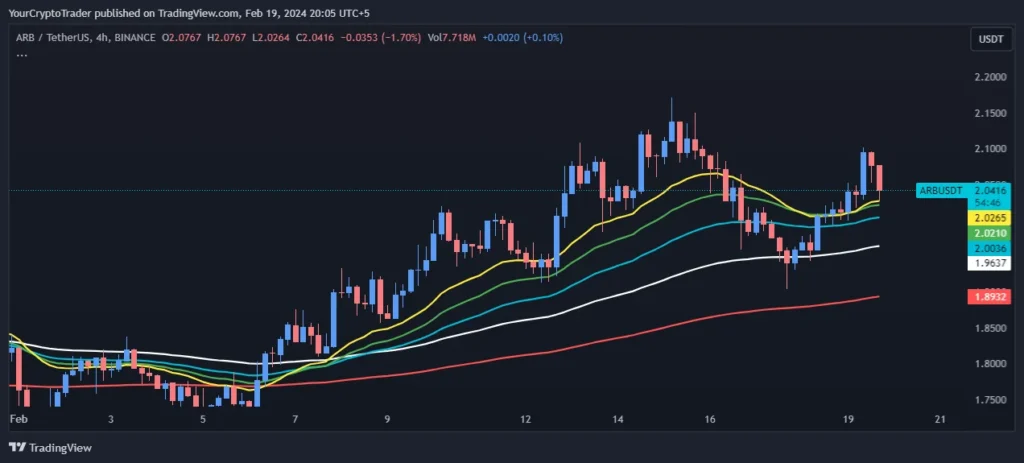
Major moving averages are in an upward sloping formation, with the price holding well above the 200 EMA. This signals strength in the current trend.
| EMA Type | EMA Price on Chart |
| 200 EMA (Red Color) | 1.8932 |
| 100 EMA (White Color) | 1.9637 |
| 55 EMA (Blue Color) | 2.0036 |
| 34 EMA (Green Color) | 2.0209 |
| 21 EMA (Yellow Color) | 2.0265 |
Fixed Range Volume Profile Levels
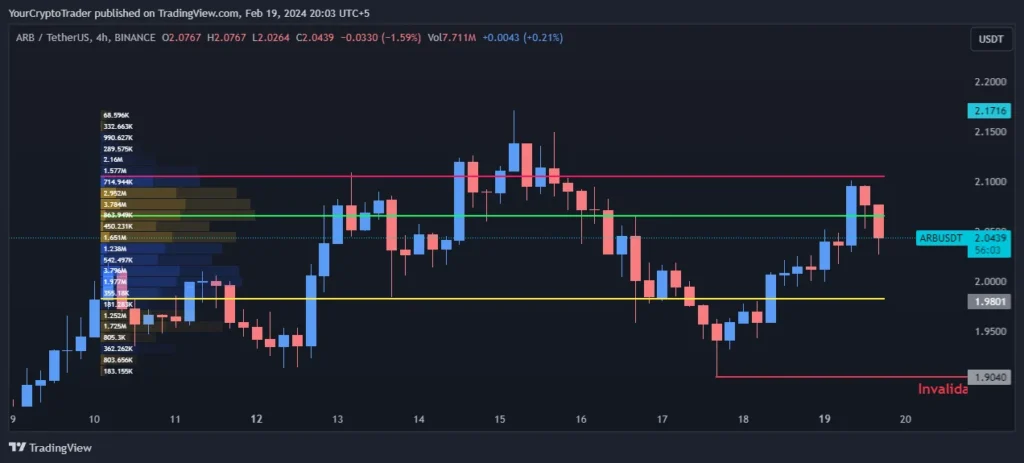
The Point of Control at 2.0665 aligns with the Value Area High, suggesting resistance in this zone between 2.1051-2.0665. Upside may be limited until a break above here.
| Point of Control (POC) | Value Area High (VAH) | Value Area Low (VAL) |
| 2.0665 | 2.1051 | 1.9821 |
Trade Bias
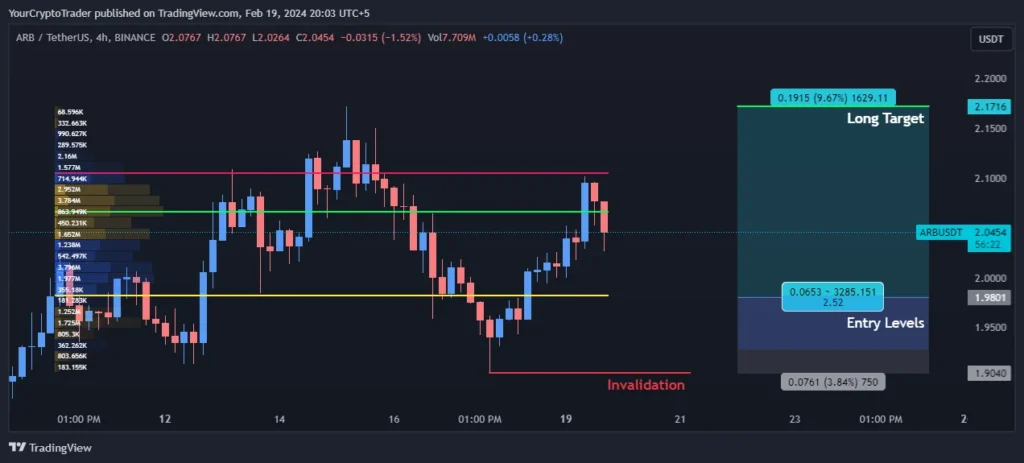
Trade Bias: Long
Entry Levels
| Entry Level Zone Number | Entry Level Price |
| Entry Levels 1 | 1.9823 |
| Entry Levels 2 | 1.9274 |
Invalidation Levels
| Invalidation Type (Long, Short) | Invalidation Price |
| Long | 1.9040 |
Target Levels
| Target Level | Target Price |
| Long Target | 2.1716 |