Demand Zones in Trading
Demand zones are powerful yet often overlooked concepts in technical analysis that can provide traders with high-probability trading opportunities. By identifying areas of previous demand on the chart, traders are able to “trade with the smart money” and take advantage of potential reversals and continuations.
However, demand zones can be difficult to discern from ordinary support levels for beginners. This article aims to demystify demand zones and illustrate how incorporating them into one’s trading strategy can elevate both precision and profitability.
Key Concepts and Terminology
Before going deeper, it’s important to clarify some key terminology. Demand zones refer to price areas where buying interest is strong enough to halt a decline. They are formed by a convergence of multiple lower shadow candlesticks, indicating an absorption of selling pressure.
Support levels, on the other hand, may only be tested once before breaking. Demand zones have withstood multiple tests, showing resilience. Other concepts like supply zones, resistance levels, and candlestick patterns will also be explored throughout this guide.
Key Takeaways
| Takeaway | Description |
| Focus on high probability zones | Professional traders only take trades where multiple criteria are satisfied to optimize trade entry and probability of success. The same applies to supply and demand zone trading. |
| Practice zone identification | Spend time analyzing charts to practice identifying valid supply and demand zones based on the rules outlined. |
| Trading assistance tools | Tools mentioned can help identify potential zones, draw them, and allow comparing strategies – helping improve skills with little cost. |
| Strategies come later | Don’t worry about strategies yet, future chapters will cover how to identify zones correctly and use them to trade. |
| Trading requires action | Reading is just the start, success requires consistent application of what’s learned and ongoing preparation, psychology, and risk management work. |
| Supply and demand patterns | Different patterns will be covered to help identify potential zones on charts before learning how to precisely define them. |
| ERCs increase probability | Engulfing and dark cloud candles within zones indicate potential power shifts, and it’s best to trade with the direction of such shifts. |
Understanding the Basics of Supply and Demand
Supply and Demand Dynamics in Financial Markets
The underlying principles of supply and demand govern all free markets, including financial markets. When demand for an asset outweighs supply, prices rise. And when supply exceeds demand, prices fall.
Large players like institutions and funds are primarily responsible for creating and testing these zones by placing large buy/sell orders. Identifying where they step in becomes key to “trading with the smart money.”
Support and Resistance Levels
Support and resistance levels refer to price thresholds that have acted as barriers in the past. They are short-term in nature and may only be tested once before breaking.
Demand and supply zones, on the other hand, show resilience through withstanding multiple tests. Breakouts from zones often result in large and meaningful moves.
Price Reversals and Demand Zones
When prices approach a demand zone, it indicates selling pressure is building. However, the area’s history of strong demand means buyers are ready to step back in. This creates an opportunity for a reversal as buying activity overwhelms selling.
By entering long positions on retests of demand zones, traders can profit from the ensuing bounce.
Exploring Demand Zones
Definition and Characteristics of Demand Zones
As mentioned earlier, demand zones are areas that have previously halted a decline multiple times due to strong buying interest. They appear on charts as a price range delineated by a cluster of candlesticks with lower shadows, but closed bodies above the zone. Other characteristics include testing by higher highs/lows, and stability over time.
Factors Influencing Demand Zones
Underlying factors like major news events, technical factors like Fibonacci retracements, or simply an accumulation of buyers’ limit orders over time can create demand zones. Identifying what events influenced the zone’s formation provides context for the trade setup.
Differentiating Demand Zones from Support Levels
While support levels and demand zones both indicate areas of prior buying interest, the latter displays resilience through withstanding multiple tests. Support levels may only be briefly touched before breaking, whereas demand zones show their strength through absorbing repeated selling pressure.
Identifying Demand Zones
Price Action Analysis
Careful price action analysis is key to spotting demand zones. Clusters of long lower shadows, engulfing candlesticks, and hammer/inverted hammer patterns often delineate the zone’s boundaries. Higher lows and volume spikes on retests add further confirmation.
Volume Analysis
Higher volume on tests of demand zones indicates renewed buying interest. Spikes in volume should coincide with a halt or reversal of the prevailing trend. Fading volume into the zone is also a bullish signal.
Chart Patterns and Indicators
Reversal and continuation patterns like head and shoulders and triangles formed within demand zones provide added context. Oscillators can also help by signaling oversold/overbought conditions on retests. Moving averages provide dynamic support/resistance as well.

Types of Demand Zones
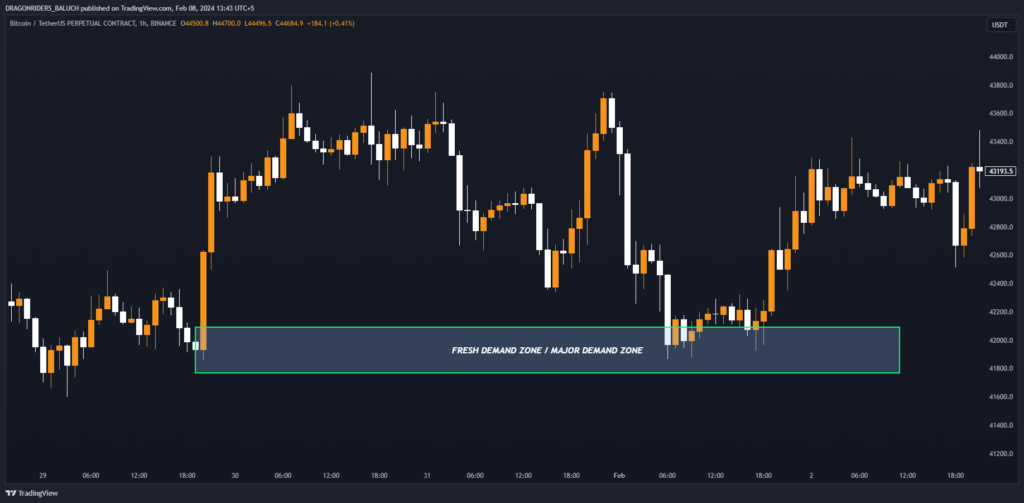
Major Demand Zones
These massive zones, often formed after large declines, indicate extremely heavy accumulation. They boast resilience through withstanding numerous higher highs/lows over extended periods. Breakouts from major zones tend to result in big moves.
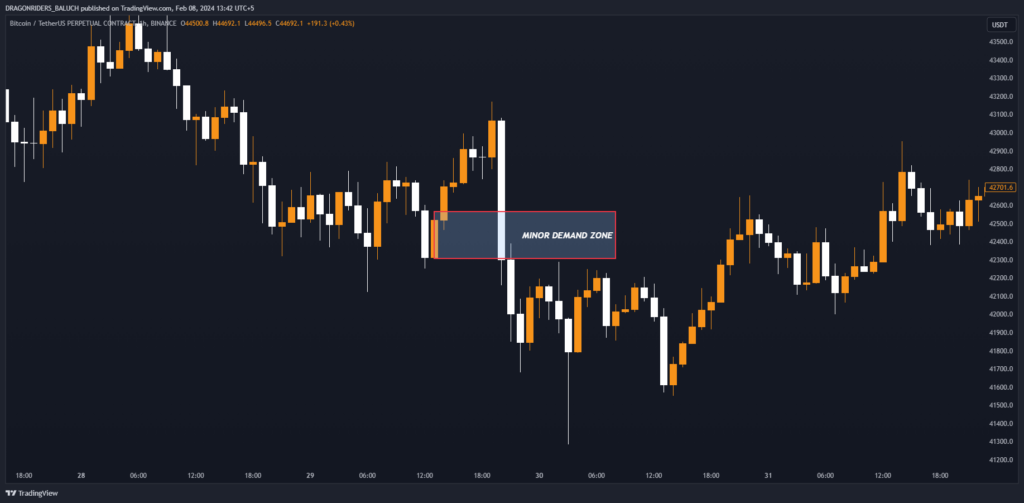
Minor Demand Zones
Smaller in size and scope than major zones, minor zones may have only withstood 2-3 retests. However, they still show prior buying interest and provide opportunities for smaller, low-risk trades.
Fresh Demand Zones
Newly formed demand zones without a track record require more confirmation. Fading volume and bullish candlestick reversals on retests start to establish the zone. Trades from fresh zones carry higher risk and reward potential.
Confirmation Techniques for Demand Zones
Multiple Time Frame Analysis
Demand zones that appear across multiple time frames (such as the daily and 4H charts) receive additional validation. This confluence increases the likelihood of a meaningful move upon breakout or retest.
Confluence of Technical Factors
Demand zones corroborated by indicators signaling oversold/overbought conditions, moving average interactions, and bullish candlestick patterns provide a higher probability setup.
Candlestick Patterns
Bullish reversal patterns like the hammer, inverted hammer, and engulfing candlesticks formed within demand zones provide an early entry with a clear stop loss below the low of the pattern.
Strategies for Trading Demand Zones
Breakout Strategy
Entering long on a decisive break above the upper boundary of a demand zone capitalizes on momentum. Tight stops and trailed stops protect profits as the move extends.
Pullback Strategy
Taking long positions on retests of the lower boundary of demand zones “buys the dip.” The area’s history of demand makes further upside more likely.
Demand Zone as Profit Target
Traders can take partial profits on approaches to demand zones turned resistance, as they may now attract selling activity. The zone then becomes the primary upside target.
Managing Risks in Demand Zone Trading
Setting Effective Stop Losses
Stops below significant swing lows, demand zone lows, or bullish reversal patterns keep risk defined. Trailing stops adapt to the move for optimal risk-adjusted returns.
Position Sizing and Risk-to-Reward Ratios
Small position sizes for fresh zones balance risk management with potential rewards. Larger position sizes suit proven, multi-time frame zones with optimal risk-to-reward of at least 1:3.
Monitoring Trade Progress
Traders must actively manage positions by raising stops to breakeven on moves in their favor, and exiting if the trade thesis is invalidated by a break of key technical levels.
Advanced Techniques for Demand Zone Trading
Order Flow Analysis
Reading order flow data within demand zones provides insights into institutional order imbalances and increases trade confirmation.
Supply and Demand Imbalances
Confluence of major supply and demand zones indicates an area of heavy accumulation or distribution. Breakouts from these areas often result in big moves.
Demand Zone Clusters
Multiple demand zones forming a “cluster” of support represent massive buying pressure. Breakouts from these areas can launch huge trends.
Common Mistakes to Avoid
Chasing Demand Zones
Resisting the urge to enter zones after strong moves have already been made helps avoid chasing prices. Faded volume adds confidence.
Disregarding Market Context and Conditions
Global macro factors and sector-specific news must be considered before trading zones. Adverse conditions may suppress bounces.
Neglecting Risk Management
Demand zone trading, while high probability, still carries risks. Defined risk controls around stops and position sizing are essential to long-term survival and growth.
Demand Zones in Different Trading Styles
Day Trading
Breakouts and retests of demand zones provide opportunities for scalping intraday moves of 20-50 pips.
Swing Trading
Swing trades of 1-5 days can target moves toward the next demand or supply zone.
Position Trading
Major multi-week zones suit position traders, who hold through zone breakouts or failures for large trends.
Leverage Trading Tools
As a trader, accurately calculating potential profits and losses on trades is crucial for proper risk management and achieving long-term success.
- Trade Simulator Tool
- Leverage Calculator – Risk Management Tool
- Calculate PnL using Leverage, Entry Price, Stoploss Price and Take Profit Price (LEST)
- Calculate PnL using Percent Moved an asset, Leverage, Amount Invested (PLA)
Conclusion
As we’ve explored throughout this guide, demand zones are invaluable tools that can be leveraged to gain an edge in the markets. By identifying zones of previous demand, traders are able to anticipate where large players are likely to step in and reverse downtrends. This allows taking advantage of high-probability trades in the direction of the smart money.
However, the key is to only focus our efforts on the most reliable and high-quality demand zones. Not every zone that appears on a chart will provide a trading opportunity. We must be selective and apply filters like those discussed to optimize our trade selection.
This includes analyzing factors like volume, order flow, candlestick patterns and whether the zone has held as support/resistance on multiple timeframes.