The analysis covered both the 4-hour and 1-hour timeframes. On the 4-hour chart, AVAX USDT is in an upward trend, with support between $33.50-33.87 and resistance at $35.62-35.98. Fibonacci retracement levels between 0.382-0.786 provides potential pullback targets. A demand zone is identified from $33.65-34.67 based on previous rebounds.
On the 1-hour chart, there are two nearby support zones and resistance at the current price. Fib retracement levels of 0.382-0.882 may also act as support. A demand zone is found between $34.20-34.58. Additionally, two bullish fair value gaps represented areas where new buying interest could emerge.
4 Hour Timeframe
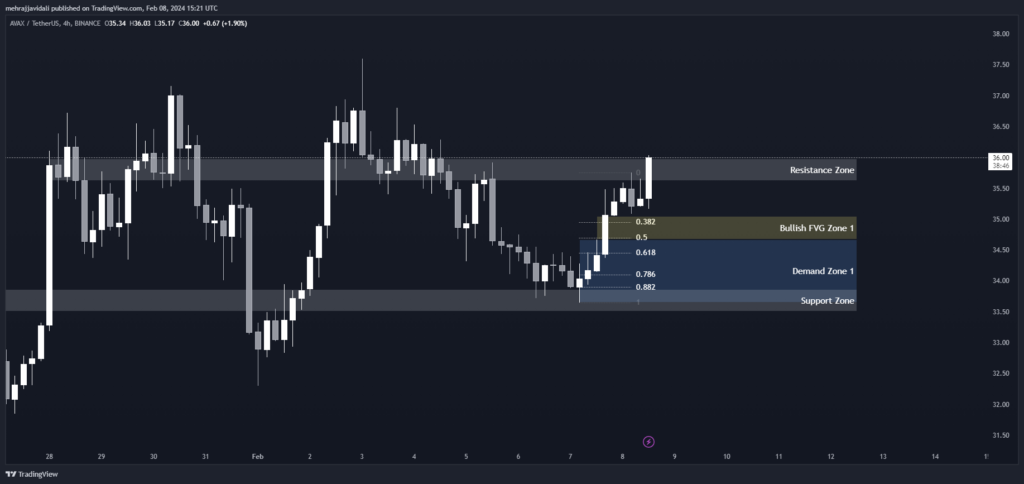
The current price of AVAX/USDT is $35.81. On the 4 hour chart, the price is in an upward trend as indicated by higher highs and higher lows over the past few weeks.
Support and Resistance Levels
There is a supportive demand zone between $33.50-33.87 that could prop up the price if it drops. Above that, resistance lies in the $35.62-35.98 range. These were identified by finding past price action areas on the chart where the asset reversed direction.
| S / R Type | High | Low |
| Support Zone | 33.87 | 33.50 |
| Resistance Zone | 35.98 | 35.62 |
Fibonacci Retracement Levels
Pulling fib retracement from the recent swing low to high, the 0.382, 0.50 and 0.618 levels provide logical retracement targets at $34.95, $34.70 and $34.45 respectively in the case of a short term pullback. The 0.786 level at $34.10 may also act as support.
| 0.382 | 34.95 |
| 0.50 | 34.70 |
| 0.618 | 34.45 |
| 0.786 | 34.10 |
| 0.882 | 33.90 |
Demand Zone
On the 4H chart, a demand zone has been identified between $33.65-34.67 based on multiple rebounds from this area in recent history. A drop to this zone could present a buying opportunity.
| Zone Number | High | Low |
| Demand Zone 1 | 34.67 | 33.65 |
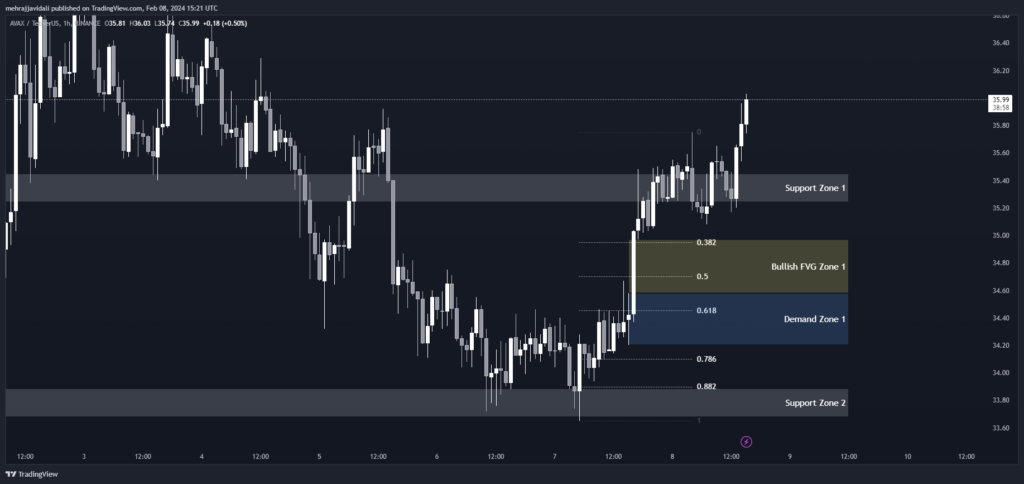
1 Hour Timeframe
Support and Resistance Levels
There are two nearby support zones from previous price action lows. Stronger support lies at $35.24–35.45, with minor support below at $33.68–33.89. Resistance is seen at the current price level.
| S / R Type | High | Low |
| Support Zone 1 | 35.45 | 35.24 |
| Support Zone 2 | 33.89 | 33.68 |
Fibonacci Retracement Levels
Fibonacci retracement drawn from the latest swing low to high shows potential pullback areas. The 50% level at $34.70 and 61.8% level at $34.46 may act as support in a short-term correction.
| 0.382 | 34.95 |
| 0.50 | 34.70 |
| 0.618 | 34.46 |
| 0.786 | 34.10 |
| 0.882 | 33.90 |
Demand Zone
A demand zone was identified from a recent upside reversal between $34.20–34.58. This zone could attract new buyers if retested.
| Zone Number | High | Low |
| Demand Zone 1 | 34.58 | 34.20 |
Fair Value Gaps / Imbalances
Two bullish fair value gaps were identified based on imbalances in price action. These at $34.58–34.67 and $34.97–35.05 represent areas where new buying interest may emerge to fill the gaps.
| Gap Number | High | Low |
| Bullish FVG Zone 1 | 35.05 | 34.67 |
| Bullish FVG Zone 2 | 34.97 | 34.58 |