BTC USDT is displaying technical signs of a continuing bullish trend above key supports. Holding above support levels on the lower timeframes maintains this positive structure.
Demand zones and fair value gaps point to potential areas of buying interest. A daily close below 41300.00 support would be needed to signal a change to a more neutral or bearish bias.
Daily Timeframe
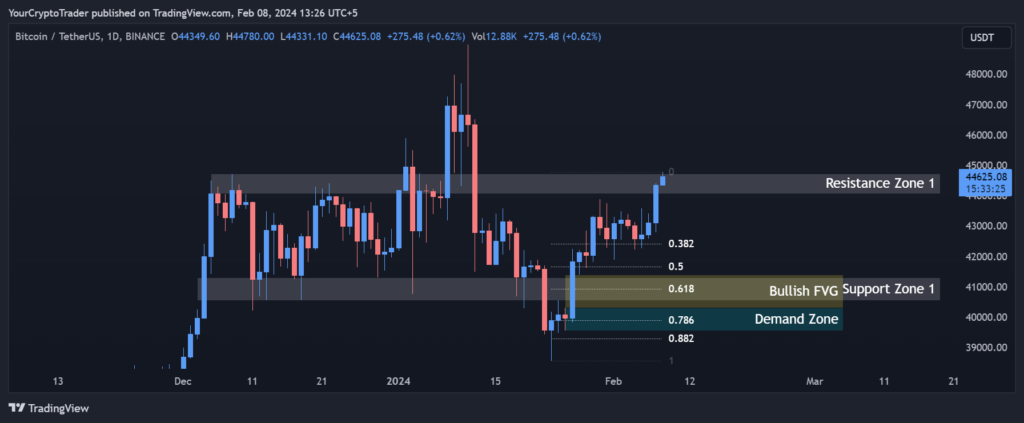
Bitcoin BTC USDT remains in an overall bullish trend above key support areas. The price is currently trading between the resistance zone of 44073.32 – 44731.10 and support zone of 41300.00 – 40542.93. A close below the support zone could signal a change in trend to neutral or bearish.
Support and Resistance Levels
| S / R Type | High | Low |
| Support Zone | 41300.00 | 40542.93 |
| Resistance Zone | 44073.32 | 44731.10 |
Fibonacci Retracement Levels
The 0.382, 0.50 and 0.618 Fibonacci retracement levels provide good support at 42403.04, 41667.42 and 40941.29 respectively. A bounce from any of these levels would maintain the bullish structure.
| 0.382 | 42403.04 |
| 0.50 | 41667.42 |
| 0.618 | 40941.29 |
| 0.786 | 39888.09 |
| 0.882 | 39292.80 |
Demand Zone
The demand zone between 40300.24 – 39550.00 could prove to be an area of buying interest if retested.
| Zone Number | High | Low |
| Demand Zone | 40300.24 | 39550.00 |
Fair Value Gaps / Imbalances
The bullish fair value gap between 40300.24 – 41394.34 shows an area of positive momentum that may be revisited in the future.
| Gap Number | High | Low |
| Bullish FVG | 40300.24 | 41394.34 |
4 Hour Timeframe
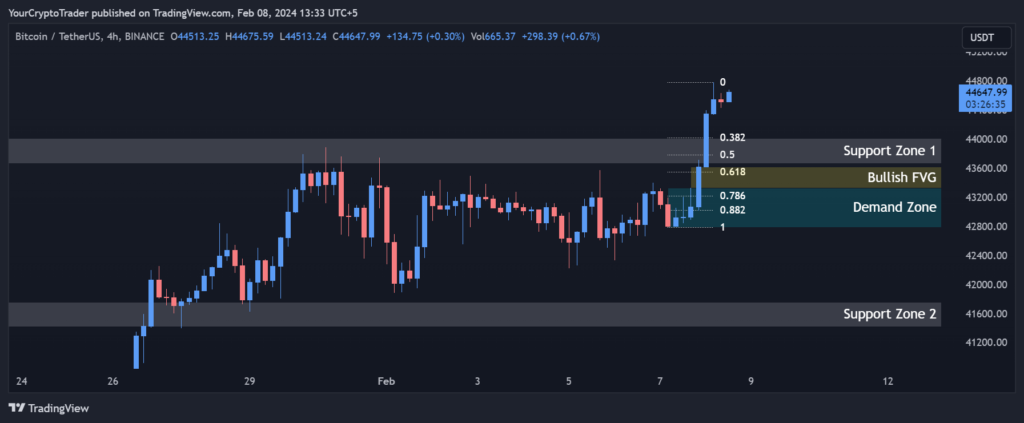
Zooming into the 4 hour chart, we can see support zones have formed at 44006.43 – 43667.66 and 41758.77 – 41420.00. Holding above these zones maintains the current bullish momentum.
Support and Resistance Levels
| S / R Type | High | Low |
| Support Zone 1 | 44006.43 | 43667.66 |
| Support Zone 2 | 41758.77 | 41420.00 |
Fibonacci Retracement Levels
Key Fibonacci retracement levels lay at 44018.60, 43783.48 and 43548.38. A bounce from any of these levels indicates continued bullish structure.
| 0.382 | 44018.60 |
| 0.50 | 43783.48 |
| 0.618 | 43548.38 |
| 0.786 | 43214.39 |
| 0.882 | 43022.02 |
Demand Zone
The demand zone between 43325.03 – 42788.00 may attract buyers if retested.
| Zone Number | High | Low |
| Demand Zone | 43325.03 | 42788.00 |
Fair Value Gaps / Imbalances
The bullish fair value gap from 43325.03 – 43615.47 signals potential buy pressure could emerge in this zone.
| Gap Number | High | Low |
| Bullish FVG | 43325.03 | 43615.47 |
1 Hour Timeframe
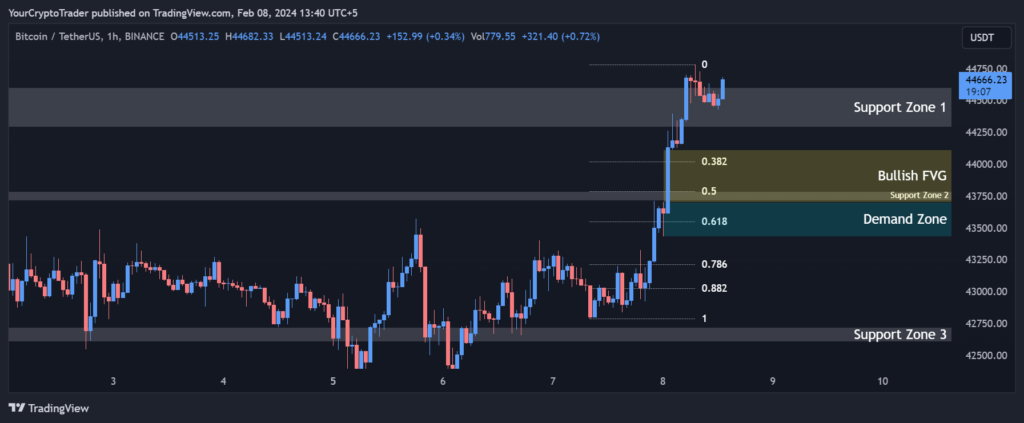
Support lies at 44600.00 – 44293.48, 43787.35 – 43715.04, 42720.33 – 42606.38 and 41475.82 – 41251.64. As long as these supports hold, the short term trend remains bullish.
Support and Resistance Levels
| S / R Type | High | Low |
| Support Zone 1 | 44600.00 | 44293.48 |
| Support Zone 2 | 43787.35 | 43715.04 |
| Support Zone 3 | 42720.33 | 42606.38 |
| Support Zone 4 | 41475.82 | 41251.64 |
Fibonacci Retracement Levels
Fibonacci retracement levels provide resistance turned support at 44018.44, 43787.43, 43547.85 and 43214.47.
| 0.382 | 44018.44 |
| 0.50 | 43787.43 |
| 0.618 | 43547.85 |
| 0.786 | 43214.47 |
| 0.882 | 43022.83 |
Demand Zone
The demand zone between 43699.98 – 43431.10 could see buying activity materialize on a revisit of this zone.
| Zone Number | High | Low |
| Demand Zone | 43699.98 | 43431.10 |
Fair Value Gaps / Imbalances
The bullish fair value gap from 43699.98 – 44113.96 signals potential upside momentum within this range.
| Gap Number | High | Low |
| Bullish FVG | 43699.98 | 44113.96 |