The confluence of demand zones, volumes profile, fib levels and technical indicators are pointing to potential upside for Bitcoin BTC USDT from current levels. As long as price holds above that major 48000 support cluster and 0.618 fib, the bullish bias looks intact for potential further gains in the weeks ahead. Keep a close eye on invalidation levels for changes in trend.
Bitcoin BTC USDT is currently trading above several key support levels after bouncing off support zone 1. The current price of 51948.98 sits right at the 0.618 Fibonacci retracement level of 50029.05, finding stability after consolidating in this area.
Let’s take a closer look at the key levels that are informing our analysis of where Bitcoin could be heading next.
Bitcoin (BTC USDT) Technical Analysis
Support Levels
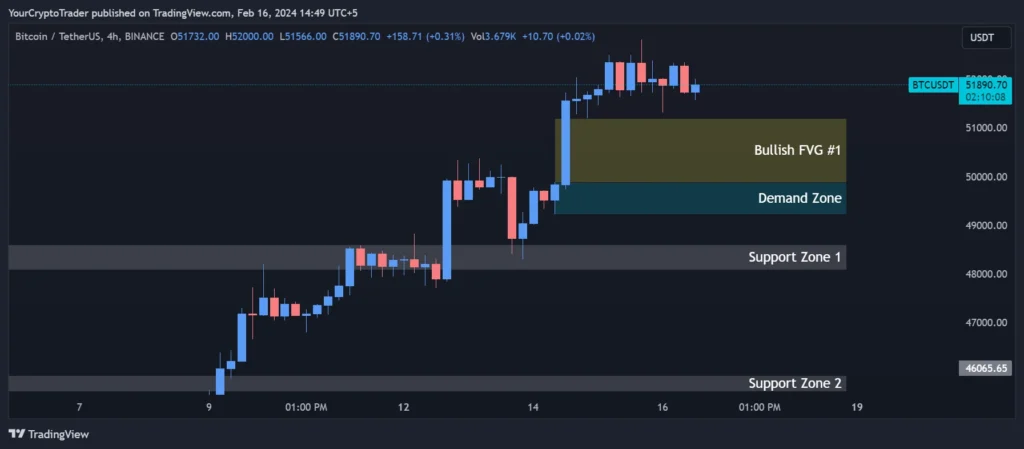
Below the current price, Bitcoin BTC USDT has several layers of strong support forming a floor. Support zone 1 at 48601.22-48081.08 was recently tested and held firm, confirming this as a major buying zone.
Below that, support zones 2 and 3 around 45900 and 44000 respectively would look to absorb any moves lower. A break below the lowest support zone 4 at 41758.77-41420 could start to turn the trend more bearish. For now, bitcoin appears well supported above these levels.
| Support Zone Number | Price High | Price Low |
| Support Zone 1 | 48601.22 | 48081.08 |
| Support Zone 2 | 45918.90 | 45580.13 |
| Support Zone 3 | 44006.43 | 43667.66 |
| Support Zone 4 | 41758.77 | 41420.00 |
Fibonacci Retracement Levels
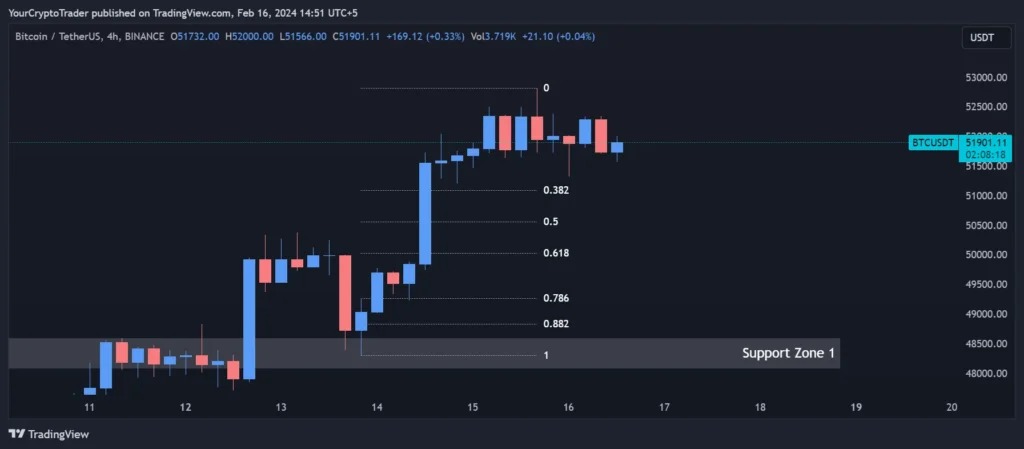
Fibonacci retracement levels drawn from the most recent swing high to low show where retracement targets exist. The 0.618 level of 50029 we are currently trading at provided an area of stability on the retracement. Holding above here keeps the bullish bias intact. The 0.50 and 0.382 levels above also align with potential upside targets.
| Fib Retracement Value | Price |
| 0.382 Fib Level | 51085.63 |
| 0.50 Fib Level | 50557.87 |
| 0.618 Fib Level | 50029.05 |
| 0.786 Fib Level | 49266.65 |
| 0.882 Fib Level | 48846.76 |
Demand Zones
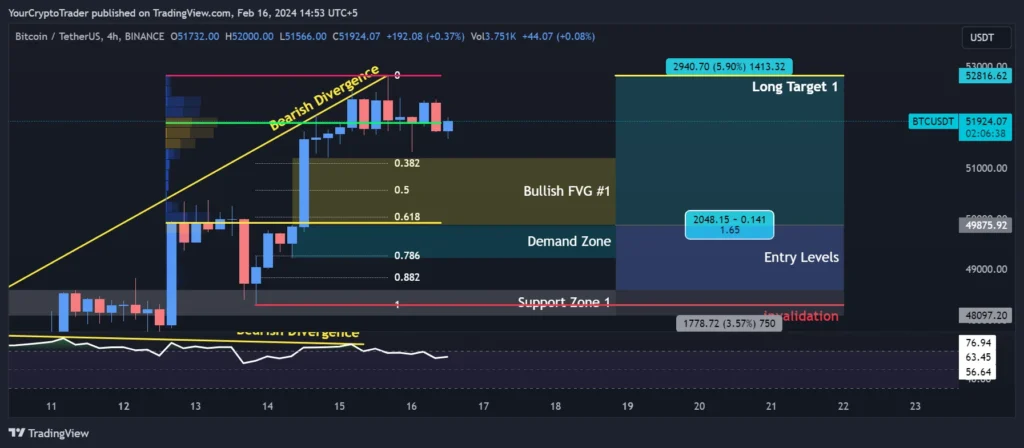
We also see a demand zone formed between 49877-49225, as prices found willing buyers in this area during previous consolidations. This demand zone aligns well with support provided by the 0.382 Fibonacci retracement level of 51085 and adds confluence to the area acting as support again.
| Demand Zone Number | Price High | Price Low |
| Demand Zone | 49877.22 | 49225.01 |
Fair Value Gaps / Imbalances (FVG)
An open bullish fair value gap is visible between 49877-51200. Fair value gaps (FVG) tend to get filled over time, either by price rising to fill the upper shadow of the gap or falling to fill the lower wick. This adds bullish potential for prices to rise to challenge the top of this FVG.
| FVG Zone Number | Price High | Price Low |
| Bullish FVG | 49877.22 | 51200.24 |
Fixed Range Volume Profile Levels
The volume profile shows a clear point of control at 51886 and aligns well with support provided by demand zones and Fibonacci levels in this price region. The value area high of 52831 and low of 49918 also give us defined upside and downside levels to be aware of on longer timeframes.
| Point of Control (POC) | Value Area High (VAH) | Value Area Low (VAL) |
| 51886.52 | 52830.56 | 49918.15 |
Relative Strength Index (RSI) Levels
The RSI is showing some bullish divergence forming with higher lows on price versus lower lows on the RSI at 48200. This adds validity to the recent low holding and points to more upside potential as momentum improves. An RSI above 50 also keeps the medium-term trend looking positive.
Current RSI Level: 62.59
Bullish or Bearish Divergences
Bearish Divergence: 48200.00
Trade Bias for BTC USDT
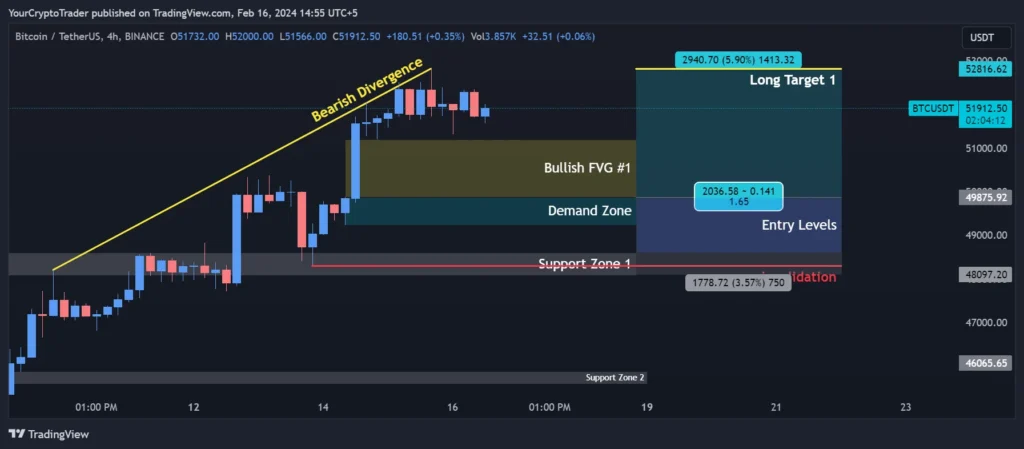
Pulling this all together, the confluence of supports from demand zones, fib levels, and major support clusters keeps the scale tipped in favor of the bulls. For now the bias remains long, with potential upside targets at key resistance and open bullish outlook levels like the point of control, fair value gap upper shadow, and fib extensions.
Trade Bias: Long
Entry Levels
The current price consolidating at the 0.618 fib level, this provides an area to initiate or add to long positions between 49863-50029. Stop loss orders below the fib and demand zone looks like a solid risk/reward setup.
| Entry Level Zone Number | Entry Level Price |
| Entry Levels 1 | 49863.82 |
| Entry Levels 2 | 48593.31 |
Invalidation Levels
A break below the strong support cluster between 48200-48300 would be needed to turn the immediate trend more bearish and potentially invalidate the long bias. This aligns closely with the bearish divergence level seen on the RSI as well.
| Invalidation Type (Long, Short) | Invalidation Price |
| Long | 48300.95 |
Target Levels
Upside targets for potential profit taking exist at the volume point of control of 52816, with extensions to main resistance in the 53000-54000 area if bullish momentum persists. Conservative targets could be reached on a break above the current price and 0.618 fib level.
| Target Level | Target Price |
| Long Target 1 | 52816.26 |