The technical indicators on FIL USDT point to range-bound movement in the near term, with potential for a break of the $5.166-$5.212 resistance to resume the upward trend. Downward moves may be limited by demand at $5.074-$4.976 zone.
4 Hour Timeframe
Support and Resistance Levels
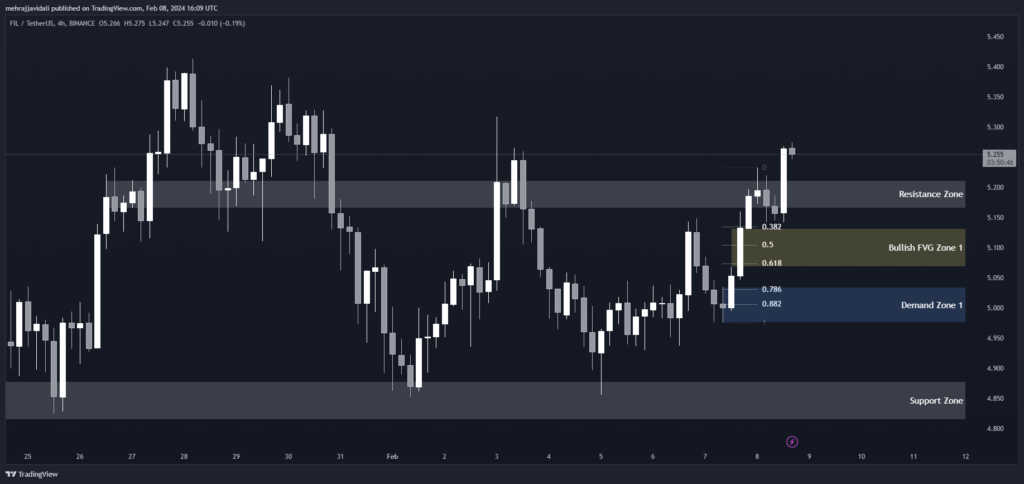
The price is currently finding resistance in the $5.212-$5.166 zone. Immediate support lies at the $4.878-$4.814 zone. These levels will need to be broken for the trend to continue in either direction.
| S / R Type | High | Low |
| Resistance Zone | 5.212 | 5.166 |
| Support Zone | 4.878 | 4.814 |
Fibonacci Retracement Levels
Paying attention to the Fibonacci levels can provide potential reversal areas. The 0.382 level at $5.134 may act as resistance. Support may be found at the 0.50 level of $5.104 or the 0.618 level of $5.074.
| 0.382 | 5.134 |
| 0.50 | 5.104 |
| 0.618 | 5.074 |
| 0.786 | 5.031 |
| 0.882 | 5.006 |
Demand Zone
The price of FIL USDT may find support in the demand zone ranging from $5.035 to $4.976. This overlaps with the 0.786 Fibonacci level and prior swing high/low, making it an important area to watch.
| Zone Number | High | Low |
| Demand Zone 1 | 5.035 | 4.976 |
Fair Value Gaps / Imbalances
Any fair value gaps still present on the chart of FIL USDT could attract buying or selling pressure and act as magnets on a pullback or breakout respectively.
| Gap Number | High | Low |
| Bullish FVG Zone 1 | 5.132 | 5.068 |
1 Hour Timeframe
Traders will pay attention to the Fibonacci support levels for signs of bounce. Meanwhile, the demand zone and fair value gaps provide zones where long positions can be entered on pullbacks. As long as the 1 hour trend for FIL USDT remains bullish, further upside is expected to fill the gap levels and test potential resistance.
Fibonacci Retracement Levels
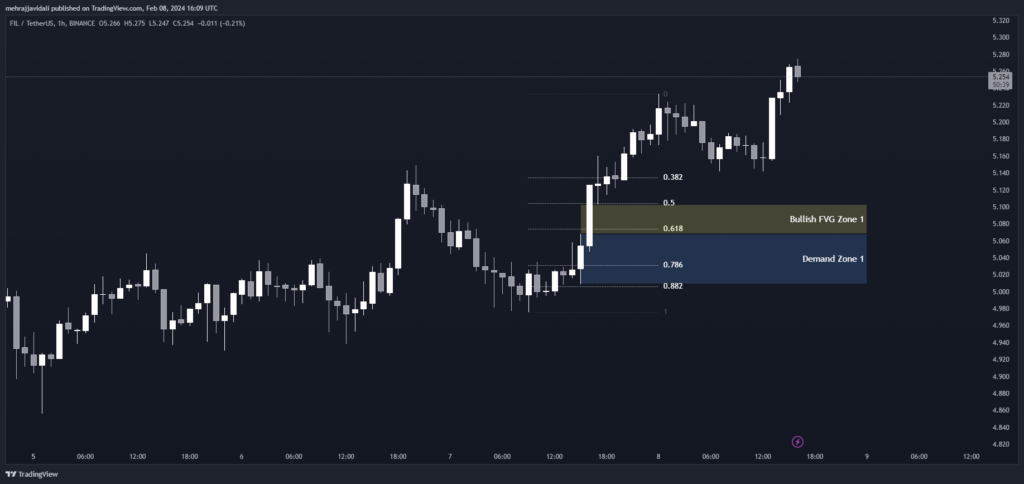
The price of FIL USDT is currently trading at 5.262. Based on the Fibonacci retracement levels provided, there are potential support levels around 5.134, 5.104, 5.074 and 5.031. Traders will be watching these levels closely for signs of a bounce.
| 0.382 | 5.134 |
| 0.50 | 5.104 |
| 0.618 | 5.074 |
| 0.786 | 5.031 |
| 0.882 | 5.006 |
Demand Zone
Looking at the demand zones, there is a key area of demand ranging from 5.068 to 5.009. This zone makes sense given the current price is right above this range. If the price moves lower, this demand zone could attract buyers looking for an entry.
| Zone Number | High | Low |
| Demand Zone 1 | 5.068 | 5.009 |
Fair Value Gaps / Imbalances
There is an imbalance between 5.103 to 5.068 signaling potential bullish price action may occur to fill this gap. Similarly, the second gap from 5.132 to 5.068 also points to bullish momentum.
| Gap Number | High | Low |
| Bullish FVG Zone 1 | 5.103 | 5.068 |