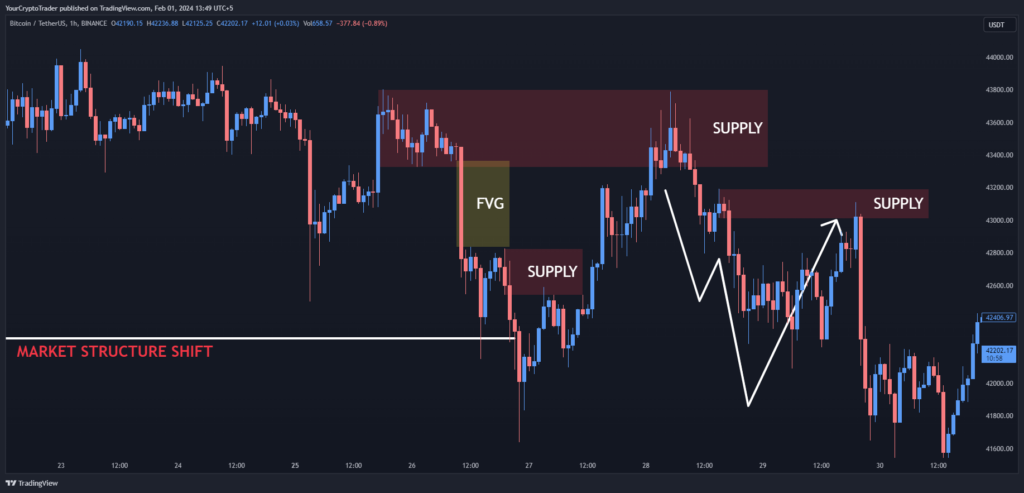
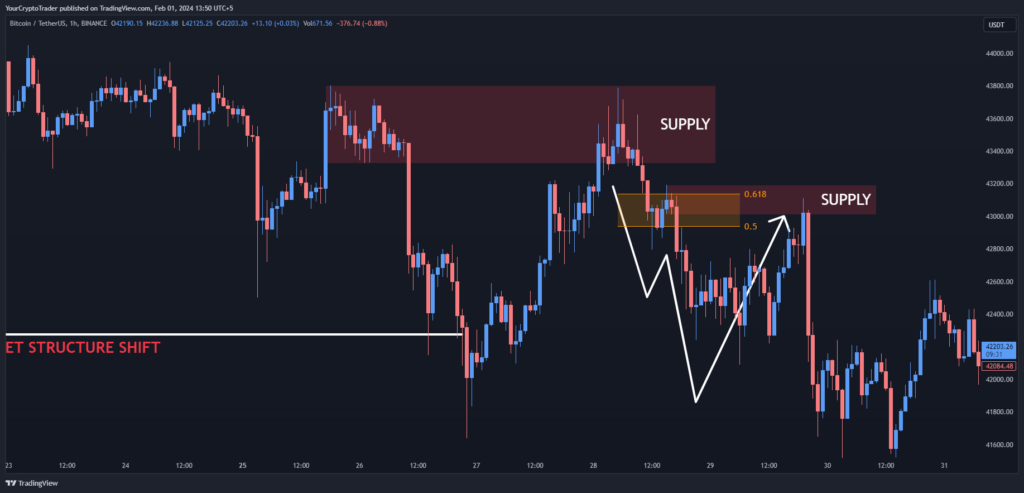
Supply zones are one of the most important concepts for any trader to understand. By identifying areas of heavy supply on the chart, traders can anticipate where sellers may step in to defend those levels. This allows traders to plan their entries based on how the price reacts at these zones. Mastering supply zone analysis can significantly improve a trader’s ability to trade with the trend and catch major market moves.
In this article, we will provide a comprehensive overview of supply zone trading. We will explore the key concepts, how to identify supply zones, different types of zones, trading strategies, risk management principles and more. By the end, readers will have a solid foundation to incorporate supply zone analysis into their own trading approach.
Key Takeaways
| Takeaway | Details |
| Focus on high probability zones | Only trade setups where multiple criteria are satisfied to increase chances of success. Don’t chase every signal. |
| Practice zone identification | Spend time analyzing charts to get better at spotting supply and demand zones. Be patient in your learning. |
| Use confirmation techniques | Candlestick patterns can confirm zone reactions for higher probability trades. Look for engagement signals. |
| Optimize your strategy | Applying concepts like zone flips and enhancers can improve your strategy over time based on past results. |
| Leverage trading tools | Free tools are mentioned that can help identify zones and measure strategy effectiveness with community feedback. |
| Understand market context | Imbalances, order flow, and specific candlestick types provide context around zones strength and trade potential. |
| Master zone drawing | Accurately defining zones sets the foundation for all further analysis and trade planning. Spend time learning this skill. |
The Basics of Supply and Demand
To understand supply zones, we must first grasp the fundamentals of supply and demand. In financial markets, supply and demand refer to the balance of buyers and sellers for a given asset. When demand is high and supply is low, prices rise as buyers absorb the available supply. Conversely, heavy supply and low demand will cause prices to fall.
Support and resistance levels emerge where there is a historical balance between buyers and sellers. Levels that have triggered reactions in the past act as guideposts for where future reactions may occur. By analyzing past market behavior, traders can identify areas of heavy supply or demand that may influence future price action.
It is also important to define the difference between a zone and a single price level. Zones encompass a range, rather than a single number, reflecting the area over which buyers/sellers are active. This gives more flexibility, as the price does not need to hit the exact number to trigger a reaction.

Exploring Supply Zones
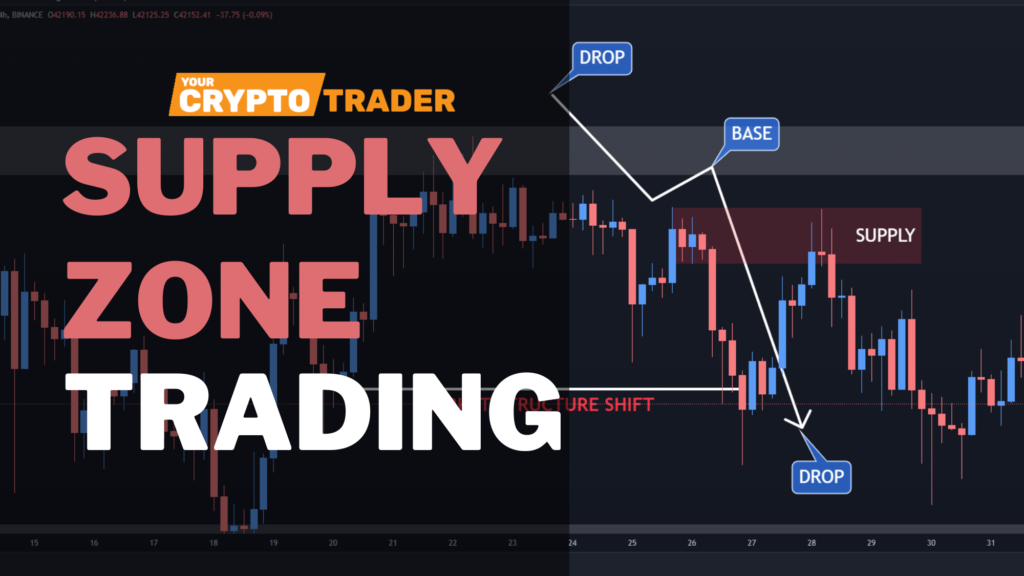
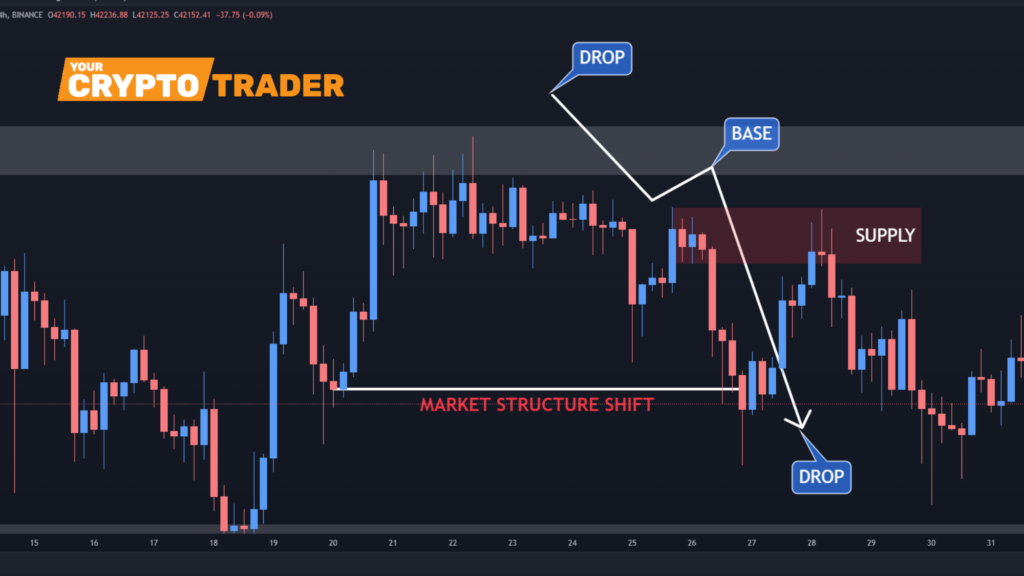
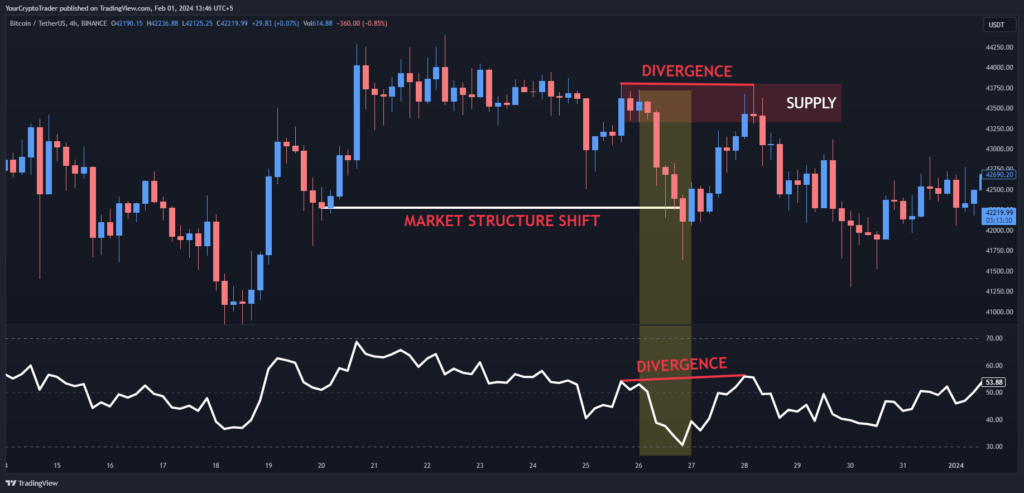
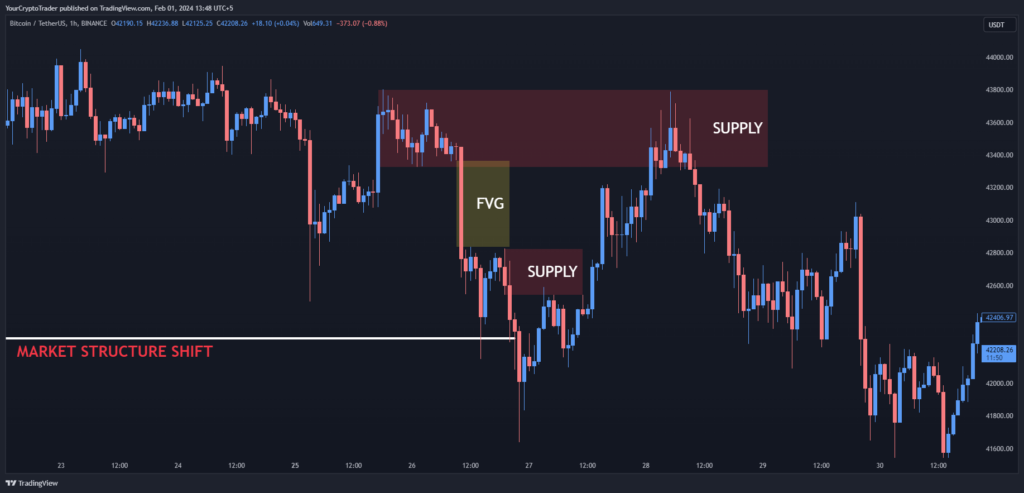
Supply zones, in particular, represent areas where sellers were previously active in driving down prices. Some key characteristics of supply zones include heavy selling activity, prior resistance points, and order block levels. The strength and relevance of a zone depends on factors like the time period since it was formed, volume, and price action surrounding the area.
It is also crucial to differentiate supply zones from basic resistance levels. Zones tend to be broader price ranges defined by order flow activity, while resistance is a single static number. Zones also imply an imbalance that may be corrected, whereas resistance can persist indefinitely.
Identifying these subtle differences is important for gauging how the market may react upon retesting identified zones. Let’s now explore some techniques for locating supply zones on the chart.
Identifying Supply Zones
The most reliable way to spot supply zones is through a confluence of factors:
Price action – Look for prior resistance points, reversal/consolidation areas, and changes in market structure around the zone. Significant swings high define where sellers stepped in strongly.
Volume – Heavier volume on downswings and around resistance points indicate heavier seller participation. Spikes in volume add confidence to a zone.
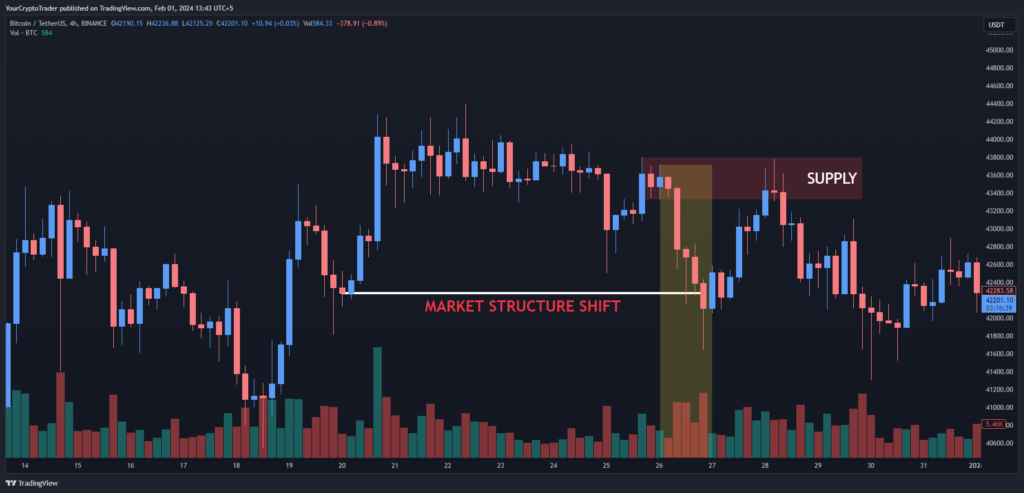
Chart patterns – Reversal/continuation patterns like double tops and descending triangles often form at supply zones.
Indicators – Divergences between price action and oscillators like RSI can signal temporary tops. Moving averages provide dynamic resistance levels.
The more evidence from different approaches, the more likely it is a valid supply zone deserving of our attention. Let’s now explore various types of supply zones traders may encounter.
Types of Supply Zones
Not all supply zones are created equal. Their strength depends on factors like:
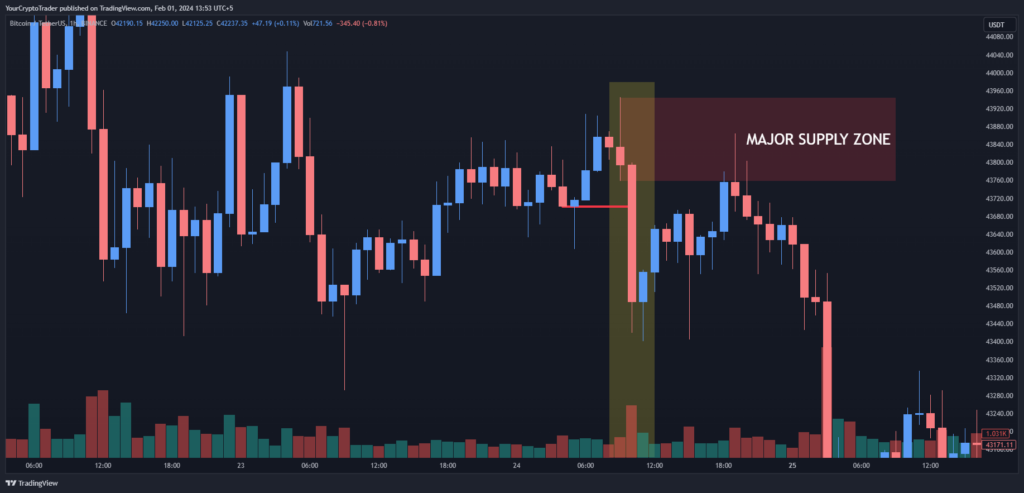
Major zones – Areas that triggered large reactions in the past, often demarcating major trend changes. Command the most attention due to their influence.
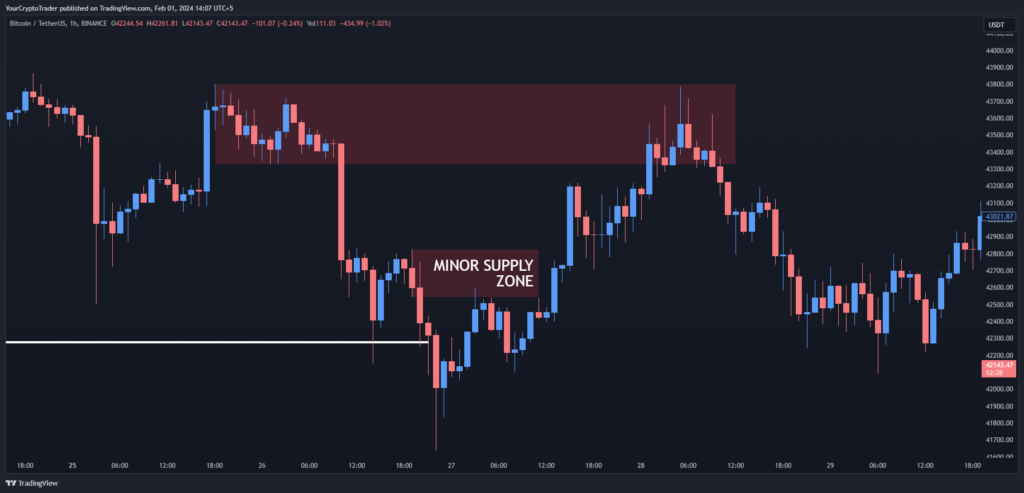
Minor zones – Less impactful than major, but still caused some reaction. Provide an early signal that a major zone may be tested.
Fresh zones – Newly formed, so untested. Require confirmation on retest before treating it as legitimate. Less history to analyze.
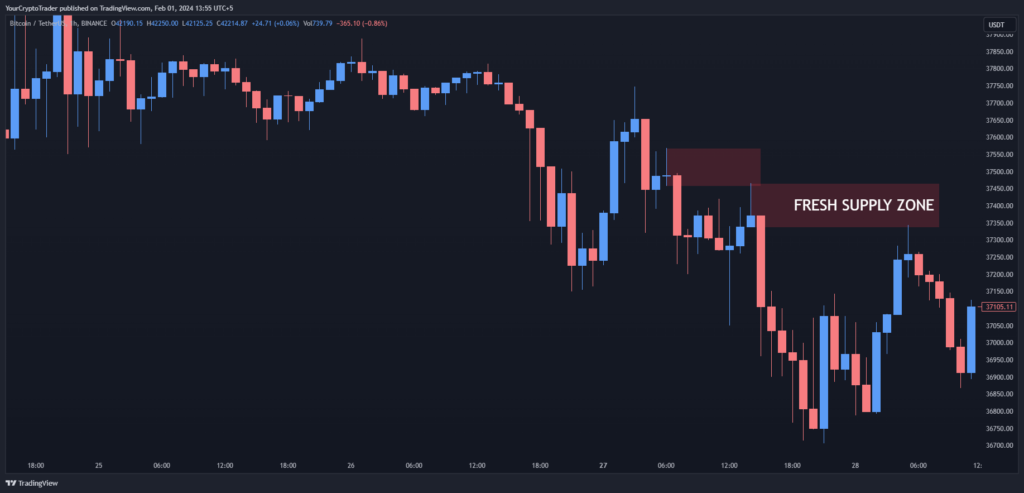
The interplay between these zone types provides layers of support/resistance for traders to exploit. Major zones act as ultimate targets, while minor and fresh zones may foreshadow further weakness if breached.
Supply Zone Confirmation Techniques
Validating potential zones is crucial before acting on them. Some ways to achieve confirmation include:
Multiple time frame analysis – Look for confluence between zones on larger and smaller scales for added confidence.
Confluence of technical factors – Seeing price action confirmation alongside supportive volume and indicators adds objectivity.
Candlestick patterns – Formations like bearish engulfing patterns signaling a shift in momentum if seen on retests.
Without confirmation, zones risk being premature or invalid. Traders must be selective and only trade the highest conviction setups that show signs of the market truly testing identified supply. Patience is important to avoid acting too hastily on unconfirmed zones.
Supply Zone Trading Strategies
Once confident in a supply zone, traders can employ various strategies:
Breakout strategy – Selling short precisely as the zone is breached, anticipating further weakness. Requires tight stops.
Pullback strategy – Waiting for a retest that holds as support, then shorting subsequent weakness from within the zone. Reduces risk vs. breakouts.
Zone as profit target – Shorting with the zone as upside target, taking partial profits on retests. Remainder held for a potential larger move.
The best approach depends on individual risk tolerance, market conditions and zone context clues. Being flexible between strategies optimizes entries while managing downside exposure.
Managing Risks in Supply Zone Trading
While supply zones offer high probability trade setups, risk management is crucial for survival in the long-run. Some principles include:
- Setting initial stop losses beyond the upper bound of the zone to avoid being stopped out on brief spikes.
- Using position sizing to limit overall risk to 1-2% of account per trade.
- Structuring trade plans with predefined risk-to-reward ratios of at least 1:3.
- Monitoring trades closely as they progress and trailing stops dynamically to lock in profits.
- Avoiding overconfidence – zones may fail on retest due to changed market conditions.
Supply zone trading need not be risky when sound risk practices are followed stringently on every trade.
Advanced Techniques for Supply Zone Trading
For those seeking an extra edge, more sophisticated approaches include:
- Order flow analysis – Using order book data to spot aggressive sellers defending zones on smaller timeframes.
- Supply and demand imbalances – Imbalances in the order flow precede reactions. Learning to identify these shifts improves entries.
- Zone clusters – Areas where multiple zones stack closely together. Break of the cluster often sparks accelerated moves.
While not necessary for all, these advanced concepts provide powerful context when incorporated judiciously into the framework above.
Common Mistakes to Avoid
No discussion of supply zone trading would be complete without covering potential pitfalls:
- Chasing zones – Only trading the highest probability setups. Avoid jumping the gun if confirmation is lacking.
- Ignoring context – Zones exist in the context of trends and cycles. Understanding the broader picture prevents fighting the tape.
- Overlooking risk management – Strong risk practices around position sizing and stops are non-negotiable for long term survival.
- Losing sight of fundamentals – Valuations, economic releases and geopolitics all influence supply and demand.
Avoiding these common mistakes separates consistent professionals from average retail traders over time.
Supply Zones in Different Trading Styles
Finally, supply zone analysis can augment many trading styles:
- Day trading – Focus on daily/4hr charts for intraday swing trade setups around tested zones.
- Swing trading – Employ zones on weekly/daily charts to capitalize on medium term moves of 100+ pips or 10% in cryptocurrencies trading.
- Position trading – Major supply zones on monthly charts outline areas for position entries holding several days to weeks.
Regardless of time horizon, understanding where sellers are likely to defend prices is pivotal. Zones provide actionable levels for traders of all styles.
Leverage Trading Tools
As a trader, accurately calculating potential profits and losses on trades is crucial for proper risk management and achieving long-term success.
- Trade Simulator Tool
- Leverage Calculator – Risk Management Tool
- Calculate PnL using Leverage, Entry Price, Stoploss Price and Take Profit Price (LEST)
- Calculate PnL using Percent Moved an asset, Leverage, Amount Invested (PLA)
Conclusion
To wrap up, we have covered the essential components for successfully incorporating supply zone analysis into one’s trading approach. Mastering their identification, different types, confirmation techniques and strategic trading around zones enhances precision and profitability.