The current price of LDO USDT is analyzed on the 4-hour and 1-hour charts. On the 4-hour chart, there are two resistance zones above between $2.967-$3.029 and $3.480-$3.567. Below lies a support zone from $2.580-$2.640.
Fibonacci retracement levels provide potential price magnets on the 4-hour chart at 0.382 ($2.943), 0.50 ($2.888), 0.618 ($2.833), 0.786 ($2.756) and 0.882 ($2.708).
On the 1-hour chart, the price finds itself within Demand Zone 1 of $2.753-$2.805. Above are three resistance zones. Fibonacci retracements may offer clues, with key support at 0.382 ($2.980), 0.50 ($2.937), 0.618 ($2.893), 0.786 ($2.832) and 0.882 ($2.797).
Traders will watch the interaction between buyers and sellers at these technical picture zones to identify potential bounces or breaks of support and resistance.
4 Hour Timeframe
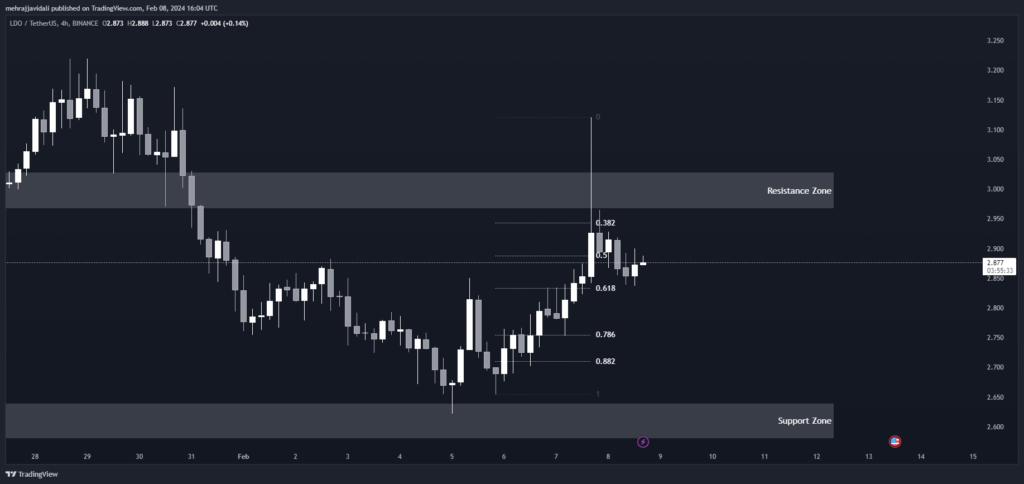
Support and Resistance Levels
Above we can see two potential resistance zones where sellers may step in between 2.967-3.029 and 3.480-3.567. Below lies one notable support zone from 2.580-2.640 that could attract buyers if the price dips down.
| S / R Type | High | Low |
| Resistance Zone | 3.029 | 2.967 |
| Resistance Zone 2 | 3.567 | 3.480 |
| Support Zone | 2.640 | 2.580 |
Fibonacci Retracement Levels
That may act as price magnets. The 0.382 level at 2.943, the 0.50 level at 2.888, and the 0.618 level at 2.833 will be watched closely for any bounce or rejection. Deeper pullbacks may find footing at the 0.786 and 0.882 levels of 2.756 and 2.708 respectively.
| 0.382 | 2.943 |
| 0.50 | 2.888 |
| 0.618 | 2.833 |
| 0.786 | 2.756 |
| 0.882 | 2.708 |
1 Hour Timeframe
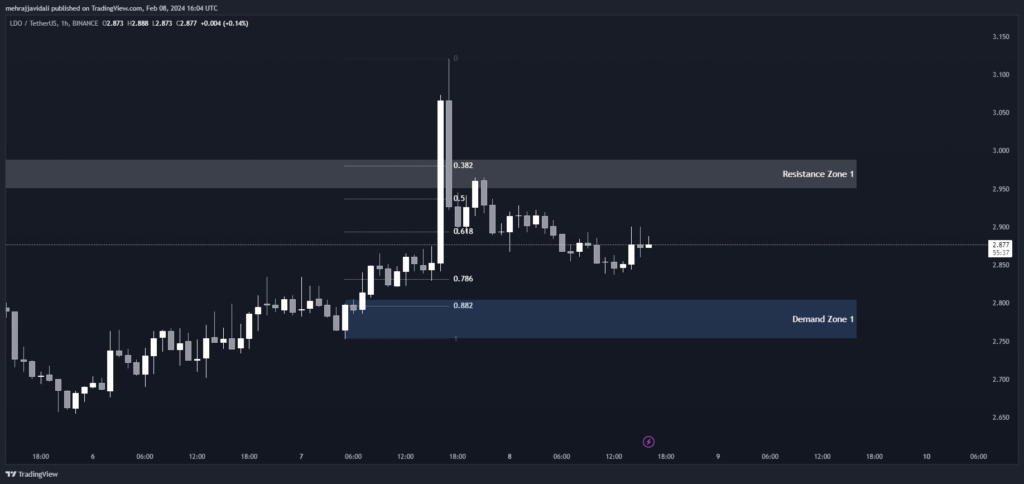
LDO USDT finds itself within a demand zone on the 1 hour chart with resistance above. A hold of support could lead to a retest of overhead barriers, while a break lower may see a decline to subsequent demand levels. Traders will be watching the interplay between buyers and sellers at these technical picture zones.
Support and Resistance Levels
There are a few notable support and resistance levels in play. Immediately above is a resistance zone between $2.950-$2.989. Above that is another zone from $3.213-$3.234. And above that is a stronger resistance level from $3.405-$3.444. These zones could potentially hold the price from rising further in the near term.
| S / R Type | High | Low |
| Resistance Zone 1 | 2.989 | 2.950 |
| Resistance Zone 2 | 3.234 | 3.213 |
| Resistance Zone 3 | 3.444 | 3.405 |
Fibonacci Retracement Levels
That may provide clues on price direction. The 0.382 level sits at $2.980 and could spark a bounce. Below that, support levels are spaced out at $2.937, $2.893, $2.832, and $2.797. A break below these may signal more downside.
| 0.382 | 2.980 |
| 0.50 | 2.937 |
| 0.618 | 2.893 |
| 0.786 | 2.832 |
| 0.882 | 2.797 |
Demand Zone
Currently, the price finds itself within a demand zone between $2.753-$2.805. This area saw buyers previously step in to absorb selling pressure. A bounce from this zone would reinforce the bullish case. However, if sellers break through, it may open the door for a drop to the next demand area.
| Zone Number | High | Low |
| Demand Zone 1 | 2.805 | 2.753 |