The current price of LINK USDT is $19.700. The overall trend seems to be ranging with a bullish bias based on the moving averages.
The technical backdrop remains bullish as long as support holds. Pullbacks to demand zones present low risk long entry opportunities targeting overhead liquidity and extension levels for profitable trades.
LINK USDT Technical Analysis
Support Levels
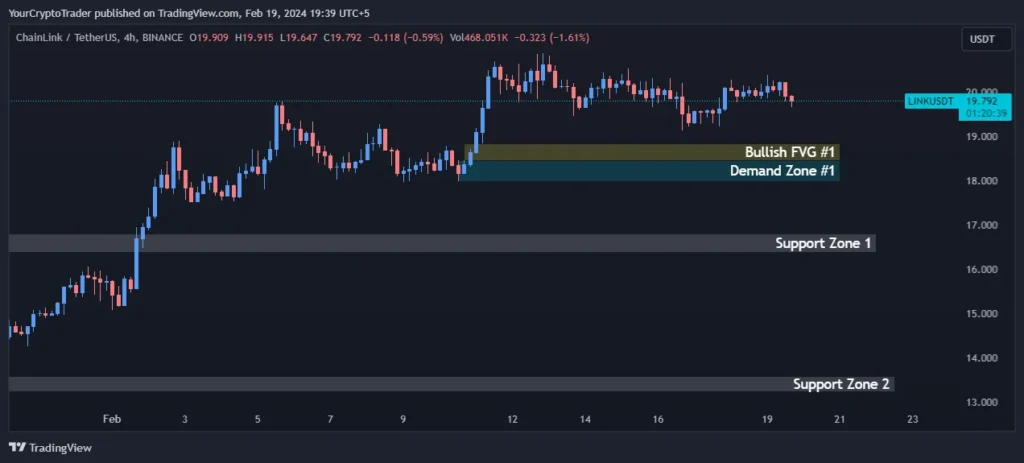
Strong support lies between $16.379-$16.794 based on previous price action. Additional support exists from $13.589-$13.240.
| Support Zone Number | Price High | Price Low |
| Support Zone 1 | 16.379 | 16.794 |
| Support Zone 2 | 13.589 | 13.240 |
Fibonacci Retracement Levels
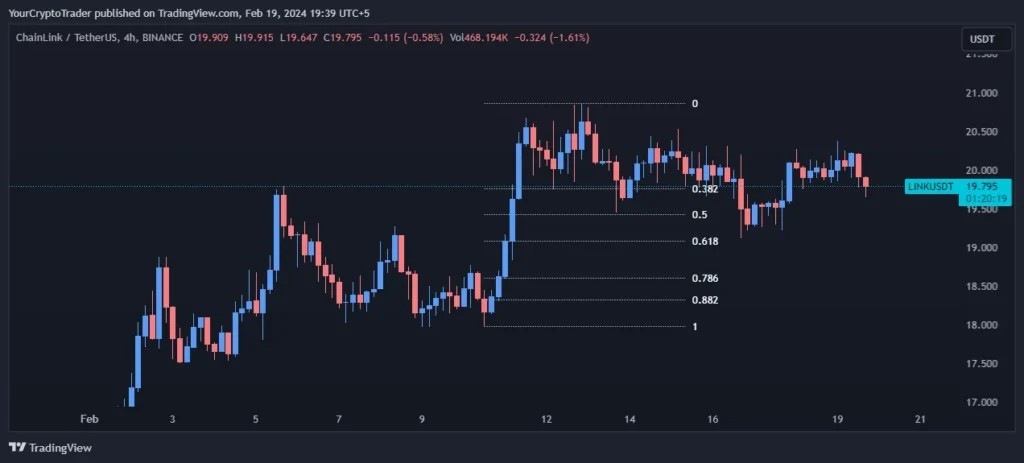
Resistance levels are provided by the 0.382, 0.50, 0.618, 0.786 and 0.882 Fibonacci retracement levels drawn from the recent swing high to low, between $19.761-$18.326.
| Fib Retracement Value | Price |
| 0.382 Fib Level | 19.761 |
| 0.50 Fib Level | 19.421 |
| 0.618 Fib Level | 19.085 |
| 0.786 Fib Level | 18.600 |
| 0.882 Fib Level | 18.326 |
Demand Zones
Buying pressure could pick up within the $18.446-$17.986 demand zone if price pulls back.
| Demand Zone Number | Price High | Price Low |
| Demand Zone | 18.446 | 17.986 |
Fair Value Gaps / Imbalances (FVG)
Overhead selling pressure may emerge in the bullish fair value gap from $18.448-$18.829
| FVG Zone Number | Price High | Price Low |
| Bullish FVG | 18.448 | 18.829 |
Exponential Moving Averages (EMA) Levels
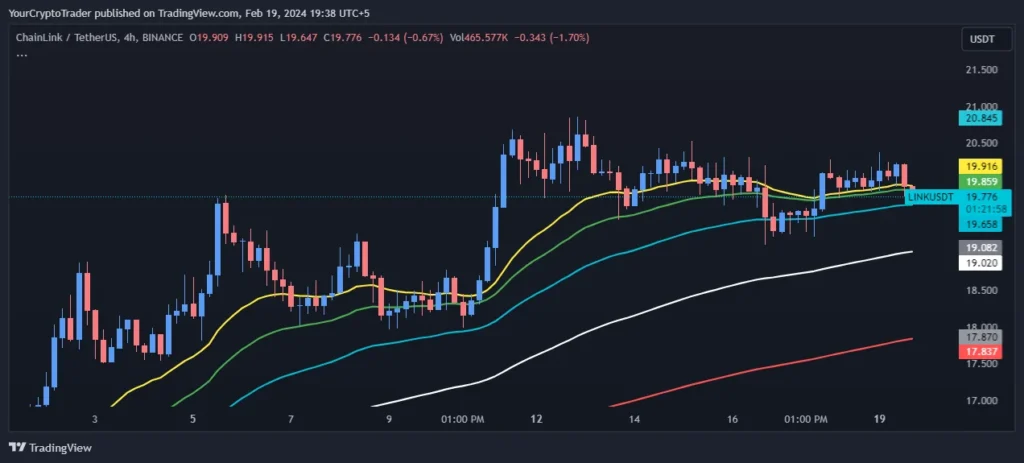
The short term moving averages are in an upward configuration showing bullish momentum. Key support exists at the 200 EMA ($17.838), 100 EMA ($19.021) and 55EMA ($19.660).
| EMA Type | EMA Price on Chart |
| 200 EMA (Red Color) | 17.838 |
| 100 EMA (White Color) | 19.021 |
| 55 EMA (Blue Color) | 19.660 |
| 34 EMA (Green Color) | 19.862 |
| 21 EMA (Yellow Color) | 19.922 |
Liquidity Levels
Previous equal lows and highs provide potential price inflection points at $17.969 and $20.845.
| Liquidity Type (Double Top, Double Bottom, Equal Lows, Equal Highs) | Price |
| Equal Lows | 17.969 |
| Equal Highs | 20.845 |
Fixed Range Volume Profile Levels
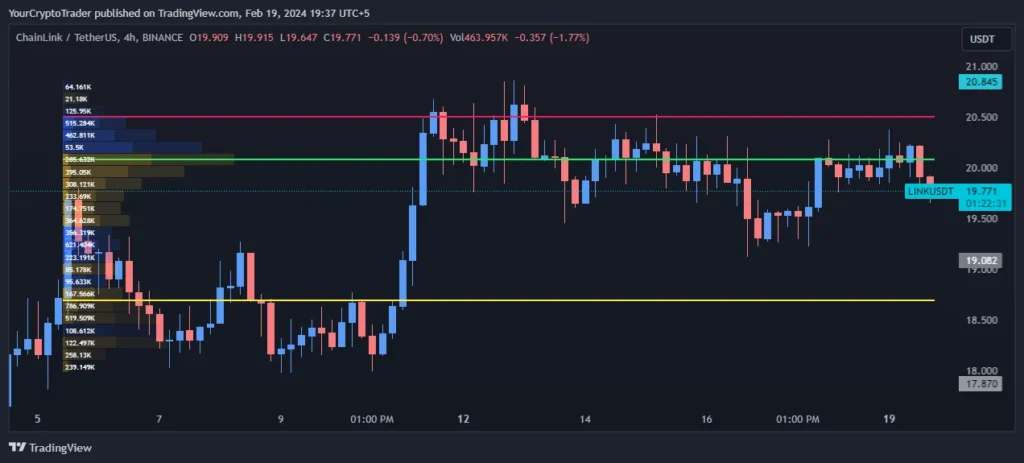
The area of highest volume traded is shown by the point of control at $20.707 with the value area between $20.482-$18.960.
| Point of Control (POC) | Value Area High (VAH) | Value Area Low (VAL) |
| 20.707 | 20.482 | 18.960 |
Trade Bias
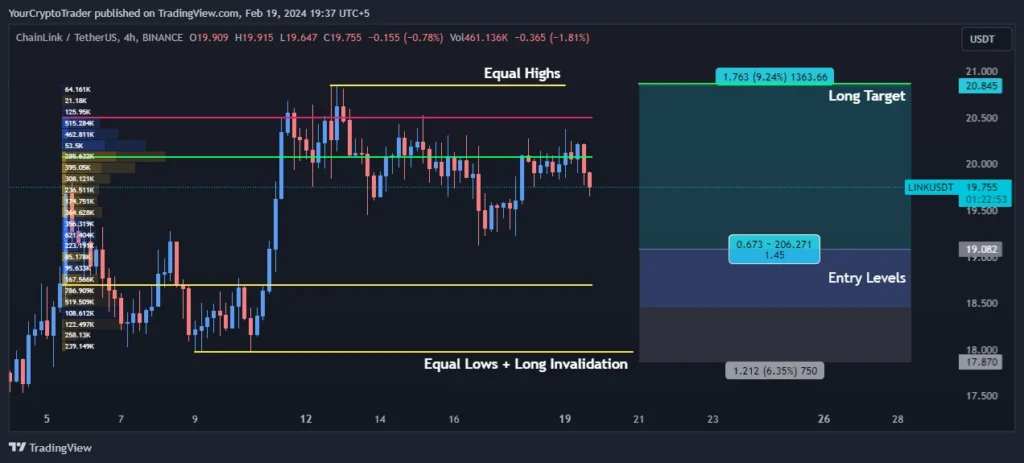
The bias is long with entry opportunities within $19.096-$18.448 demand zones. Stop loss can be placed below strong support at $17.969. Initial target is given by the long range liquidity level and Fib extension at $20.859 indicating an asymmetrical risk to reward profile.
Trade Bias: Long
Entry Levels
| Entry Level Zone Number | Entry Level Price |
| Entry Levels 1 | 19.096 |
| Entry Levels 2 | 18.448 |
Invalidation Levels
| Invalidation Type (Long, Short) | Invalidation Price |
| Long | 17.969 |
Target Levels
| Target Level | Target Price |
| Long Target | 20.859 |