The current price of MATIC USDT is 1.0068. Let us analyze the key support and resistance levels, Fibonacci retracement levels, demand zones, supply zones, EMA levels and RSI levels:
The technical are mixed but leaning bullish. A hold above 0.9002 support is needed to keep the bullish momentum intact.
MATIC USDT Technical Analysis
Support Levels
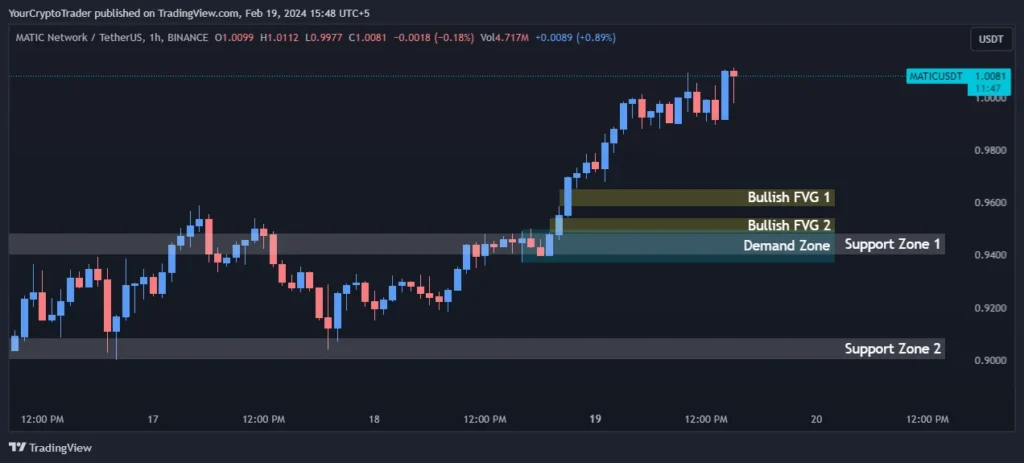
The strong near term support zones are between 0.9402-0.9485 and 0.9002-0.9086. A break below 0.9002 will turn the bias bearish.
| Support Zone Number | Price High | Price Low |
| Support Zone 1 | 0.9402 | 0.9485 |
| Support Zone 2 | 0.9002 | 0.9086 |
Fibonacci Retracement Levels
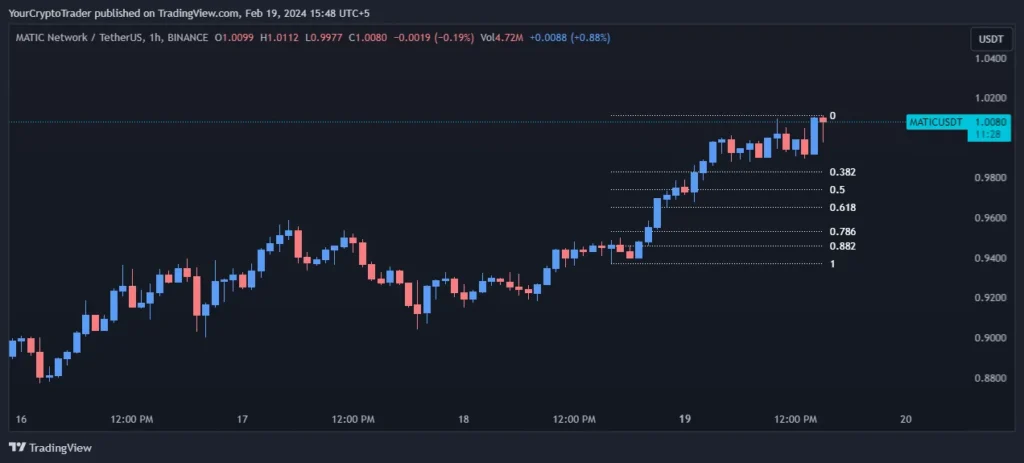
The 0.382, 0.50 and 0.618 Fibonacci retracement levels provide support at 0.9827, 0.9741 and 0.9658 respectively
| Fib Retracement Value | Price |
| 0.382 Fib Level | 0.9827 |
| 0.50 Fib Level | 0.9741 |
| 0.618 Fib Level | 0.9658 |
| 0.786 Fib Level | 0.9531 |
| 0.882 Fib Level | 0.9460 |
Demand Zones
The demand zone between 0.9500-0.9372 could attract buyers if price declines to that zone.
| Demand Zone Number | Price High | Price Low |
| Demand Zone | 0.9500 | 0.9372 |
Fair Value Gaps / Imbalances (FVG)
The bullish fair value gaps between 0.9654-0.9585 and 0.9542-0.9485 indicate accumulation zones.
| FVG Zone Number | Price High | Price Low |
| Bullish FVG 1 | 0.9654 | 0.9585 |
| Bullish FVG 2 | 0.9542 | 0.9485 |
Exponential Moving Averages (EMA) Levels
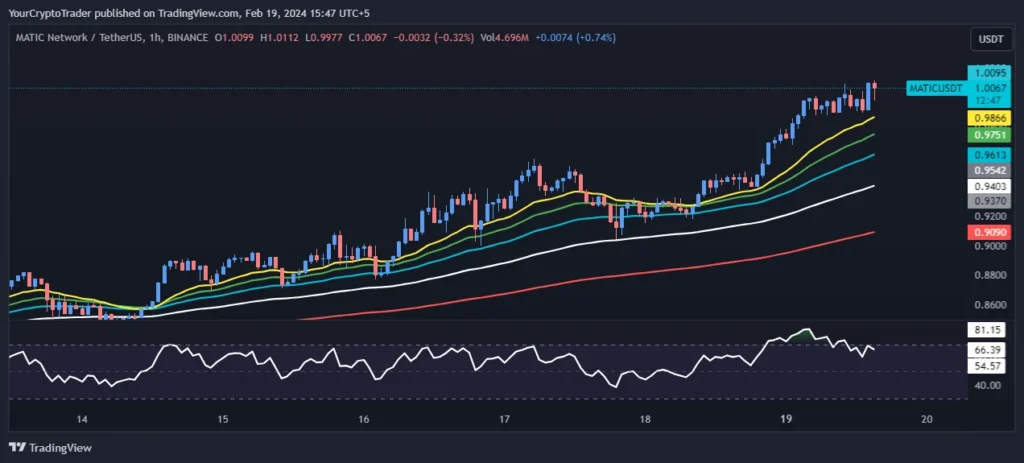
The 200 EMA at 0.9089 and 100 EMA at 0.9402 act as strong supports. 55 EMA at 0.9612 and 34 EMA at 0.9749 need to hold for the bullish momentum to continue.
| EMA Type | EMA Price on Chart |
| 200 EMA (Red Color) | 0.9089 |
| 100 EMA (White Color) | 0.9402 |
| 55 EMA (Blue Color) | 0.9612 |
| 34 EMA (Green Color) | 0.9749 |
| 21 EMA (Yellow Color) | 0.9864 |
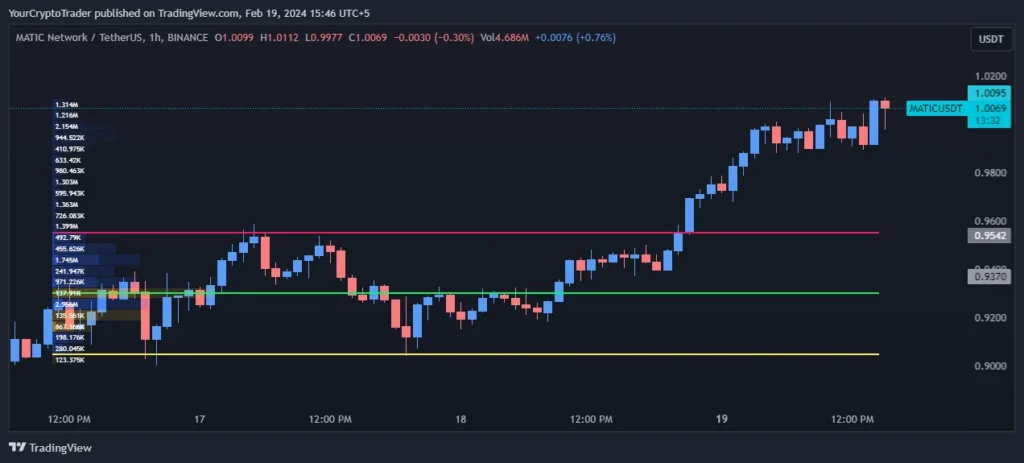
Fixed Range Volume Profile Levels
| Point of Control (POC) | Value Area High (VAH) | Value Area Low (VAL) |
| 0.9305 | 0.9563 | 0.9054 |
Relative Strength Index (RSI) Levels
The RSI of 65.37 indicates the bulls still have some steam left. As long as RSI stays above 50, the bias remains bullish.
Current RSI Level: 65.37
Trade Bias
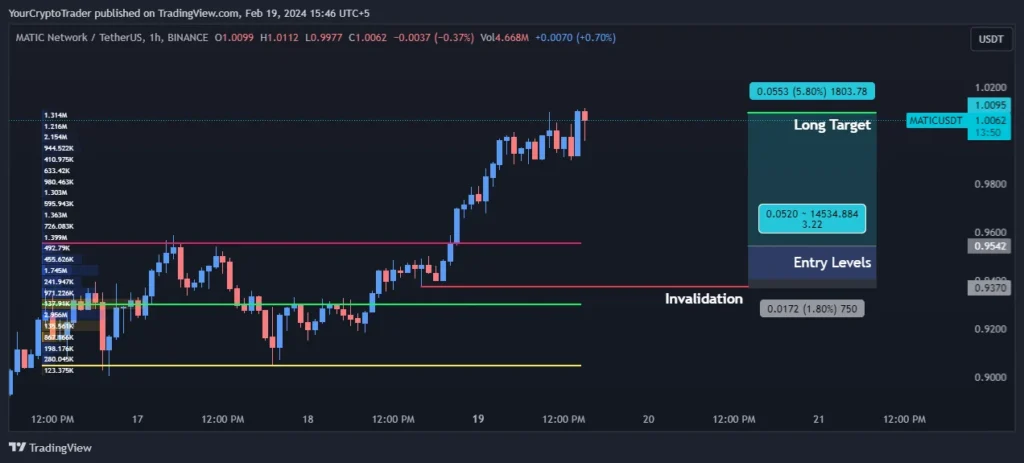
Based on the current price action and technical indicators, the trade bias is long with entry levels at 0.9542 and 0.9402. The first target is at 1.0091. The invalidation level for long trades is 0.9372.
Trade Bias: Long
Entry Levels
| Entry Level Zone Number | Entry Level Price |
| Entry Levels 1 | 0.9542 |
| Entry Levels 2 | 0.9402 |
Invalidation Levels
| Invalidation Type (Long, Short) | Invalidation Price |
| Long | 0.9372 |
Target Levels
| Target Level | Target Price |
| Long Target | 1.0091 |