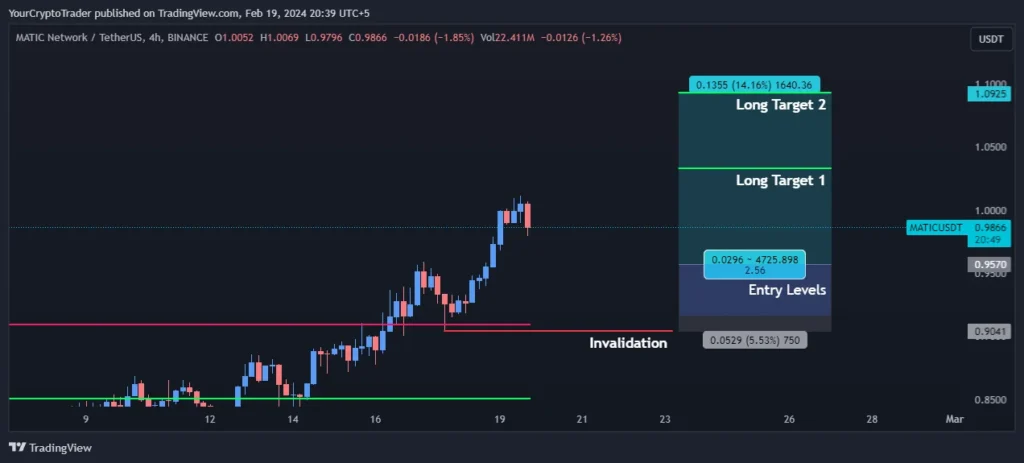
The technical depict a continuing positive momentum in MATIC USDT. Traders can look for long opportunities on dips with a stop below $0.9041. Uptrend is likely to persist till bullish structures remain intact.
The current price of MATIC USDT is $0.9898. The coin seems to be in an uptrend based on the moving averages. Let us take a deeper look at the technical patterns:
MATIC USDT Technical Analysis
Support Levels
Strong support lies at $0.9582 and $0.7617. Break below these levels could hint at a trend reversal.
| Support Zone Number | Price High | Price Low |
| Support Zone 1 | 0.9465 | 0.9582 |
| Support Zone 2 | 0.7429 | 0.7617 |
Fibonacci Retracement Levels
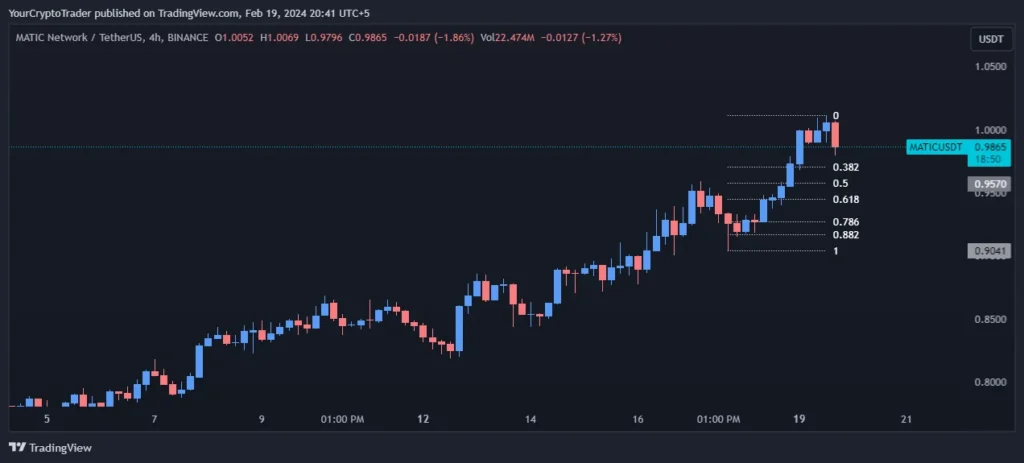
The 0.382, 0.50, and 0.618 Fib levels provide resistance at $0.9704, $0.9579, and $0.9451 respectively. A break above $0.9704 would affirm the bullish momentum.
| Fib Retracement Value | Price |
| 0.382 Fib Level | 0.9704 |
| 0.50 Fib Level | 0.9579 |
| 0.618 Fib Level | 0.9451 |
| 0.786 Fib Level | 0.9272 |
| 0.882 Fib Level | 0.9162 |
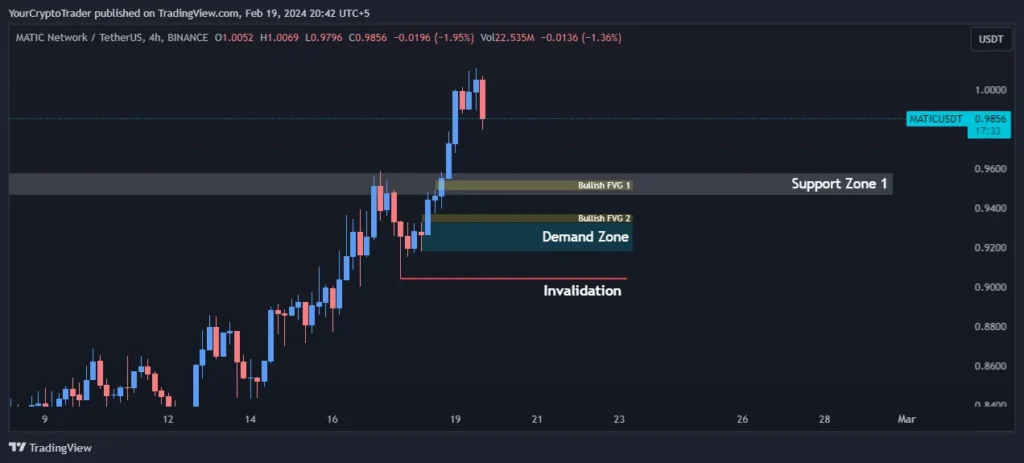
Demand Zones
| Demand Zone Number | Price High | Price Low |
| Demand Zone | 0.9326 | 0.9181 |
Fair Value Gaps / Imbalances (FVG)
The bullish FVG zones at $0.9489–$0.9542 and $0.9326–$0.9372 add to the upside potential.
| FVG Zone Number | Price High | Price Low |
| Bullish FVG 1 | 0.9489 | 0.9542 |
| Bullish FVG 2 | 0.9326 | 0.9372 |
Exponential Moving Averages (EMA) Levels
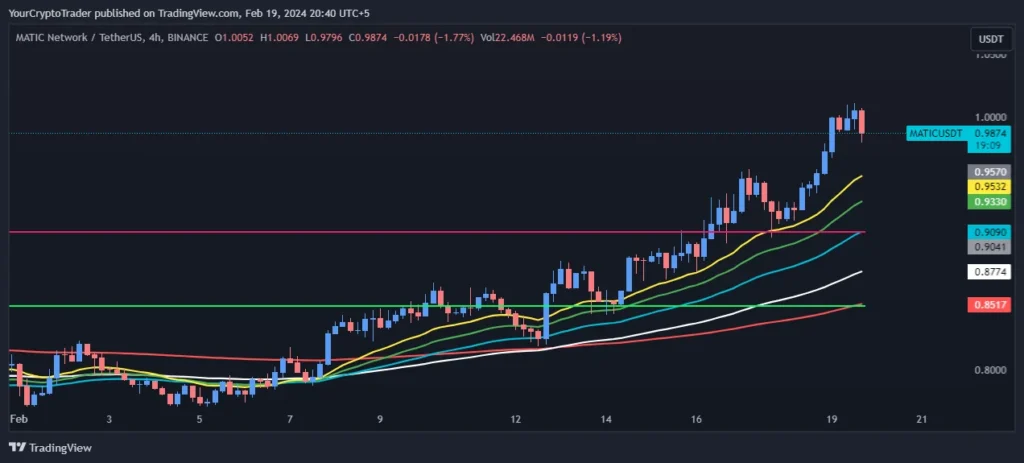
All the short-term EMAs are placed above the longer-term EMAs, showing bullish crossover and momentum. Uptrend is likely to continue till EMAs don’t generate bearish crossover signals.
| EMA Type | EMA Price on Chart |
| 200 EMA (Red Color) | 0.8518 |
| 100 EMA (White Color) | 0.8774 |
| 55 EMA (Blue Color) | 0.9091 |
| 34 EMA (Green Color) | 0.9331 |
| 21 EMA (Yellow Color) | 0.9534 |
Fixed Range Volume Profile Levels
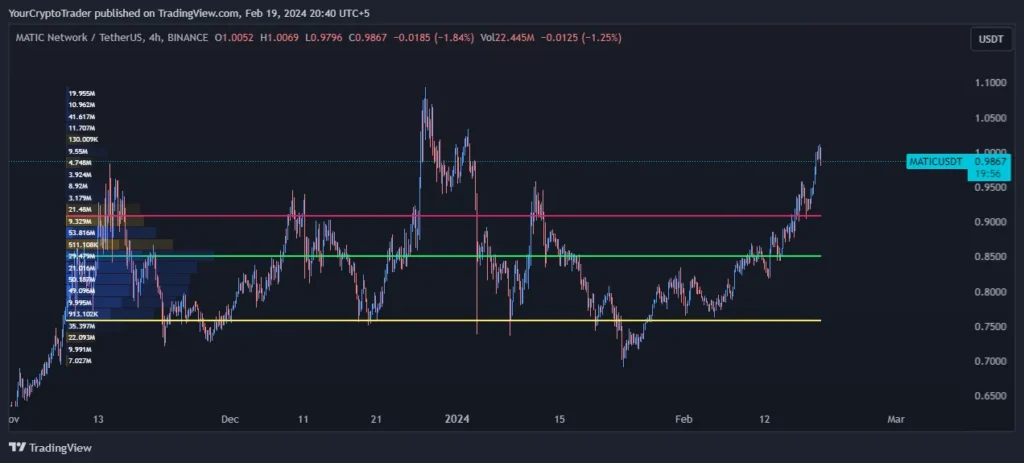
POC is seen at $0.8524 providing support. VAH of $0.9101 and VAL of $0.7578 give price targets on either side.
| Point of Control (POC) | Value Area High (VAH) | Value Area Low (VAL) |
| 0.8524 | 0.9101 | 0.7578 |
Trade Bias
The trade bias is long given the prevailing bullish technical set up across most timeframes.
Trade Bias: Long
Entry Levels
Entry can be considered at $0.9574 and $0.9163 support zones.
| Entry Level Zone Number | Entry Level Price |
| Entry Levels 1 | 0.9574 |
| Entry Levels 2 | 0.9163 |
Invalidation Levels
Place stop loss below strong support of $0.9041 to invalidate long trades.
| Invalidation Type (Long, Short) | Invalidation Price |
| Long | 0.9041 |
Target Levels
Initial target is seen at $1.0330 and next at $1.0929 resistance levels.
| Target Level | Target Price |
| Long Target 1 | 1.0330 |
| Long Target 2 | 1.0929 |