Optimism (OP USDT) is currently trading at $3.901 and appears poised for further upside potential based on the confluence of bullish technical indicators. Let’s take a closer look at the key support, resistance, trend, and momentum factors that suggest OP USDT could be ready to rally higher in the near future.
The confluence of bullish factors across multiple timeframes suggests the path of least resistance for OP USDT remains higher. As long as key support levels continue to hold on pullbacks, OP USDT appears well positioned to conquer new highs in the weeks and months ahead.
Traders are advised to maintain a bullish bias with the potential for additional gains from current levels.
OP USDT Technical Analysis
Support Levels
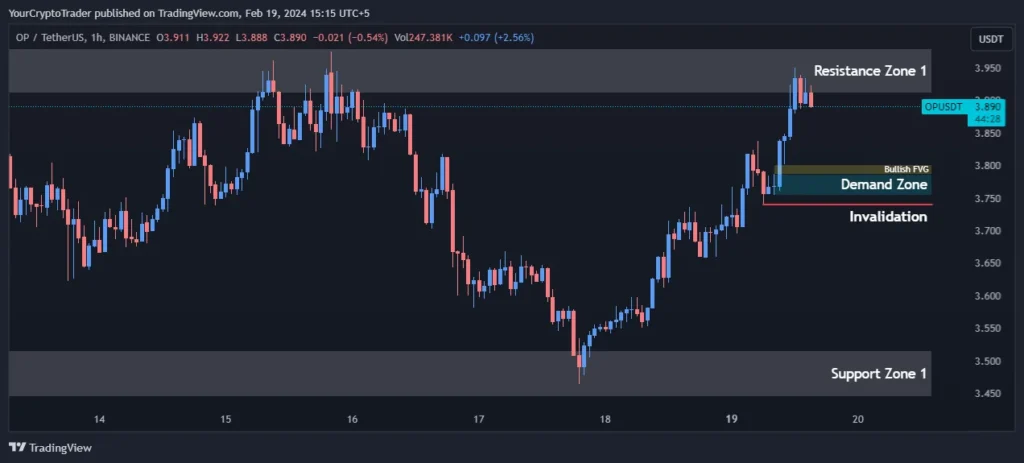
OP USDT finds strong support between $3.446-$3.516 (Support Zone 1) and $3.174-$3.242 (Support Zone 2). These price clusters provide a comfortable cushion against downside breaks and major sell-offs. As long as OP holds above these support zones, the bullish bias remains intact.
| Support Zone Number | Price High | Price Low |
| Support Zone 1 | 3.446 | 3.516 |
| Support Zone 2 | 3.174 | 3.242 |
Resistance Levels
Resistance is seen in the $3.911-$3.979 zone (Resistance Zone 1). A break above this area would confirm the bullish thesis and allow for more sustainable upside momentum to build.
| Resistance Zone Number | Price High | Price Low |
| Resistance Zone 1 | 3.911 | 3.979 |
Fibonacci Retracement Levels
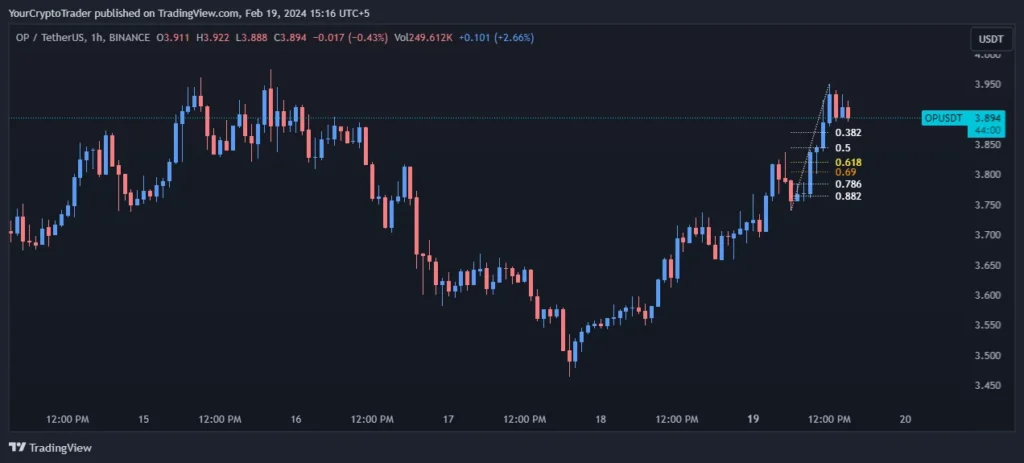
The most recent swing high to low retraced between typical Fibonacci levels, finding support at the 0.382 ($3.870), 0.500 ($3.845) and 0.618 ($3.820) levels before reversing higher. This indicates OP USDT has undergone a healthy consolidation following its recent rally, with selling pressure exhausted around these key Fib levels.
| Fib Retracement Value | Price |
| 0.382 Fib Level | 3.870 |
| 0.50 Fib Level | 3.845 |
| 0.618 Fib Level | 3.820 |
| 0.786 Fib Level | 3.785 |
| 0.882 Fib Level | 3.765 |
Demand Zones
The $3.787-$3.755 zone (Demand Zone) recently absorbed selling pressure, helping lift the price back up. Demand zones are areas where buying interest is strong – the successful retest and bounce from this area bodes well for bulls going forward.
| Demand Zone Number | Price High | Price Low |
| Demand Zone | 3.787 | 3.755 |
Fair Value Gaps / Imbalances (FVG)
The unfilled bullish FVG between $3.787-$3.801 presents an opportunistic trade setup. Prices will tend to return to fill these gaps, offering potential upside for long entries around current levels.
| FVG Zone Number | Price High | Price Low |
| Bullish FVG | 3.787 | 3.801 |
Exponential Moving Averages (EMA) Levels
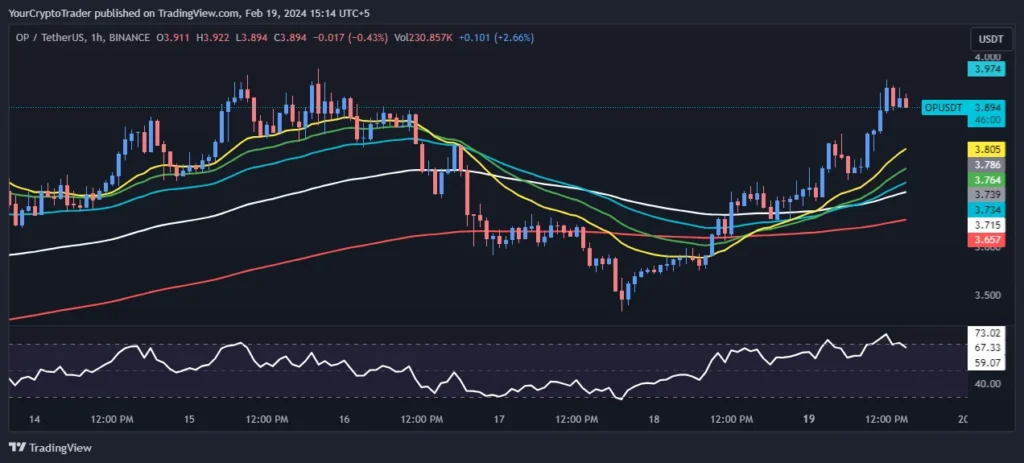
All short-term EMAs (21, 34, 55) are stacked above the longer-term 100 and 200 EMAs in a golden cross formation, indicating an upside bias. As long as OP USDT holds above these moving averages, especially the 200 EMA ($3.654), the long-term trend remains firmly bullish.
| EMA Type | EMA Price on Chart |
| 200 EMA (Red Color) | 3.654 |
| 100 EMA (White Color) | 3.711 |
| 55 EMA (Blue Color) | 3.729 |
| 34 EMA (Green Color) | 3.756 |
| 21 EMA (Yellow Color) | 3.796 |
Fixed Range Volume Profile Levels
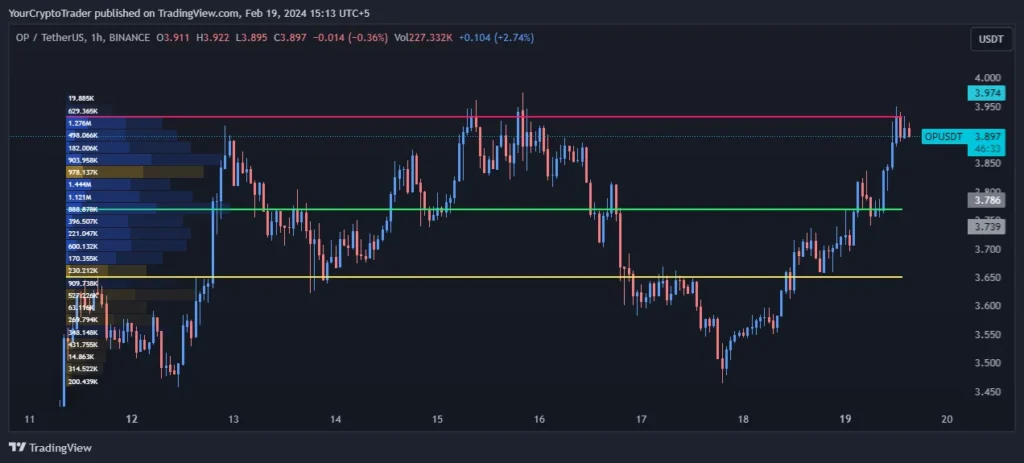
Volume is concentrated around the $3.770 Point of Control. Above average volume is seen higher from $3.650 to the Value Area High of $3.932, suggesting a higher probability of upwards continuance.
| Point of Control (POC) | Value Area High (VAH) | Value Area Low (VAL) |
| 3.770 | 3.932 | 3.650 |
Relative Strength Index (RSI) Levels
The RSI is currently sitting at 70.86 – just above overbought levels. While this implies short-term positive momentum may be peaking, historically price has continued higher after consolidating below the 70 RSI level. No apparent bearish divergence is seen.
Current RSI Level: 70.86
Trade Bias
Given the confluence of bullish factors across multiple timeframes, the current overall bias favors the long side. As long as support levels continue holding and indicators remain constructively aligned, further upside should be expected in the weeks ahead.
Trade Bias: Long
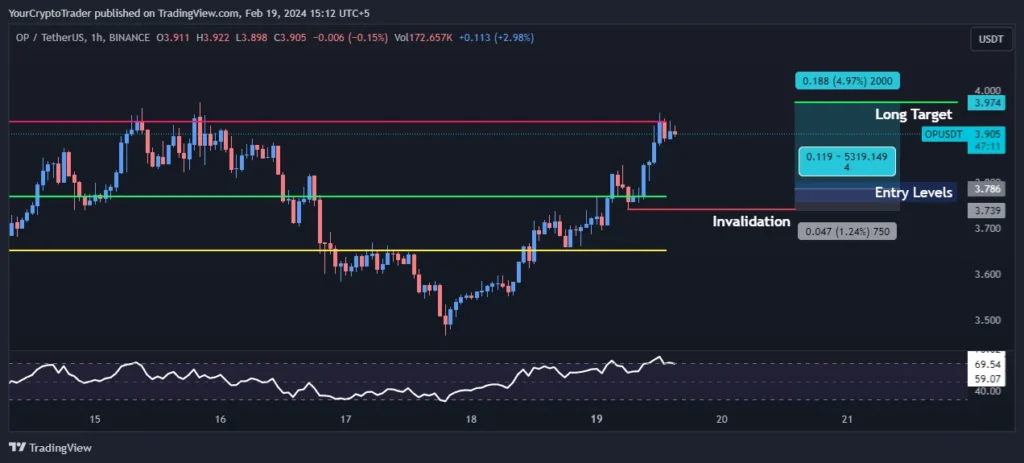
Entry Levels
Potential long entries could be taken on a retest of the $3.801 FVG high or around the $3.756 34 EMA for a more conservative position. Tight stops under major support near $3.740 help protect the trade.
| Entry Level Zone Number | Entry Level Price |
| Entry Levels 1 | 3.801 |
| Entry Levels 2 | 3.756 |
Invalidation Levels
| Invalidation Type (Long, Short) | Invalidation Price |
| Long | 3.740 |
Target Levels
Initial profit taking may find resistance around $3.973, near the 0.786 Fib retracement level of the most recent correction. However, a decisive break above the $3.911-$3.979 resistance zone on increasing volume could open the doors for a test of all-time highs in the months ahead.
| Target Level | Target Price |
| Long Target | 3.973 |