Based on the technical analysis of support and resistance levels on 4-hour and 1-hour XRP USDT charts, Ripple is currently trading within defined supply zones on both timeframes. It is facing resistance at these levels and at 0.618 Fibonacci level on the 4-hour timeframe.
A break above 0.5817 could see price rise further in the near future, while a break below 0.5441 FVG on 1-hour could lead to more downside. Traders can watch for confirmation of trends on breakdown or breakouts from these key levels.
For a more in-depth technical analysis across different timeframes, please click the link to view the identified levels of support and resistance, trends, and reversal patterns on the weekly and daily charts of XRP USDT.
4 Hour Timeframe
Current Price and Chart Analysis The current price of Ripple (XRP USDT) is 0.5084. Let us analyze the 4-hour and 1-hour charts to determine where the price is likely headed next based on technical indicators and analysis of support and resistance levels.
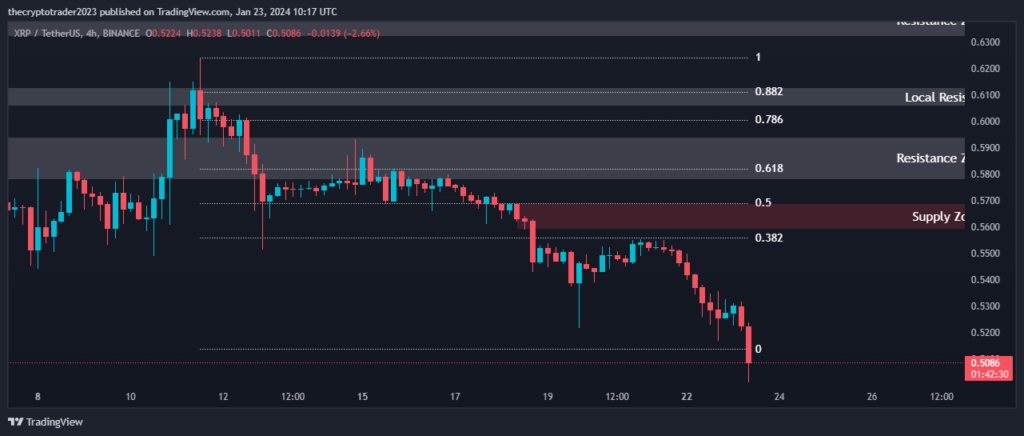
The 4-hour chart shows that XRP is currently trading within Supply Zone #1 based on the supplied data. This supply zone ranges from 0.5588 to 0.5690. XRP is finding resistance at this supply zone as well as at the 0.618 Fibonacci retracement level of 0.5817.
Above this, the next resistance levels are Resistance Level #1 from 0.5778 to 0.5941, followed by Resistance Level #2 from 0.6320 to 0.6439. Strong resistance is seen at Resistance Level #3 ranging from 0.6888 to 0.7056.
The chart also shows that XRP USDT is holding support at the 0.50 and 0.382 Fibonacci retracement levels of 0.5344 and 0.5559 respectively. Stronger support lies at the local support of 0.6056 to 0.6127.
Based on the 4-hour analysis, XRP USDT is likely to continue finding resistance in Supply Zone #1 and at the 0.618 Fibonacci level in the short term. A break above 0.5817 could see price rise further to test Resistance Level #1. However, a drop below 0.5559 Fibonacci support could lead to more downward movement.
Support and Resistance Levels
| S / R Type | High | Low |
| Resistance Level #1 | 0.5941 | 0.5778 |
| Resistance Level #2 | 0.6439 | 0.6320 |
| Resistance Level #3 | 0.7056 | 0.6888 |
| Local Resistance Level | 0.6127 | 0.6056 |
Fibonacci Retracement Levels
| 0.382 | 0.5559 |
| 0.50 | 0.5690 |
| 0.618 | 0.5817 |
| 0.786 | 0.6006 |
| 0.882 | 0.6110 |
Supply Zone
| Zone Number | High | Low |
| Supply Zone #1 | 0.5690 | 0.5588 |
1 Hour Timeframe
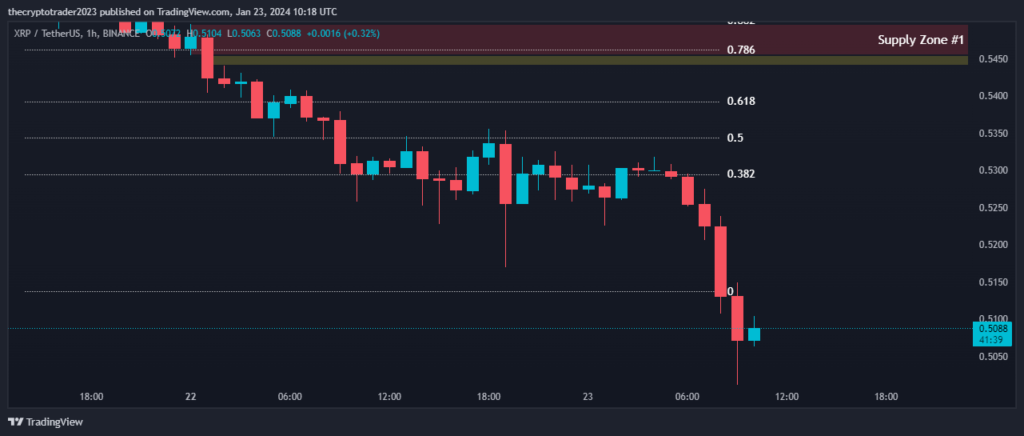
1 Hour Timeframe Analysis On the 1-hour chart, XRP USDT is currently finding resistance at the Supply Zone #1 from 0.5455 to 0.5497. Immediate support lies at the Bearish Fair Value Gap (FVG) between 0.5441 to 0.5455. Below this, Fibonacci support is seen at 0.5292, 0.5345 and 0.5392 levels.
The relative strength index (RSI) on both charts is hovering around the 50 level, suggesting lack of momentum in either direction. The moving average convergence divergence (MACD) is also flat with no bullish or bearish crossover signals seen yet.
Fibonacci Retracement Levels
| 0.382 | 0.5295 |
| 0.50 | 0.5344 |
| 0.618 | 0.5392 |
| 0.786 | 0.5461 |
| 0.882 | 0.5501 |
Supply Zone
| Zone Number | High | Low |
| Supply Zone #1 | 0.5497 | 0.5455 |
Fair Value Gaps / Imbalances
| Gap Number | High | Low |
| Bearish FVG #1 | 0.5455 | 0.5441 |