Sui Network (SUI USDT) has been in a strong uptrend over the past few months, rising over 260% from its all-time low set in October 2023.
In this technical analysis, we will take an in-depth look at the key support and resistance levels, trend lines, moving averages, and volume profiles on the 4 hour and 1 hour timeframes to determine potential reversal or continuation areas.
Read the Weekly and Daily Technical Analysis of SUI USDT.
4 Hour Timeframe
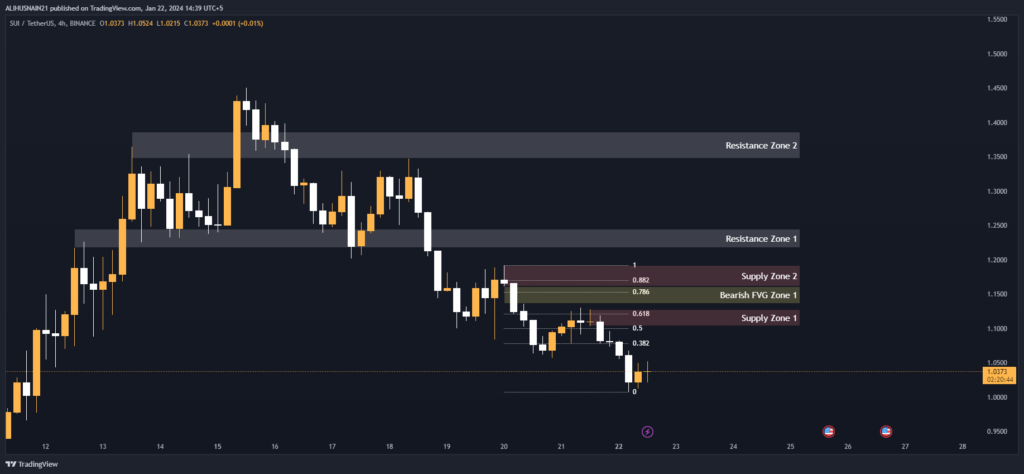
On the 4 hour chart, we can see SUI USDT is currently trading between two key resistance zones after finding support in the 1.0279 – 1.0381 area. Let’s take a closer look at these levels:
Resistance Zone 1 (1.2448 – 1.2177): This resistance zone near the 1.24 level coincides with the downtrend line connecting the higher highs since May 2023. A break above this zone would indicate a trend reversal is underway.
Resistance Zone 2 (1.3862 – 1.3472): Zone 2 provides resistance slightly above the 1.35 level and corresponds to the .618 Fibonacci retracement level of the entire downtrend. A break above this zone on increasing volume would be a strong bullish signal.
Support Zone (1.0279 – 1.0381): After finding temporary support at the .786 and .882 Fib levels, SUI USDT found a solid support floor in this zone. A breakdown below this level could point to further downside.
Supply Zone 1 (1.1276 – 1.1034): This supply zone near the 1.11 – 1.12 area was previously resistance and may now act as overhead supply on any rallies. Clearing this zone decisively would help continuation upwards.
Supply Zone 2 (1.1923 – 1.1609): Zone 2 sits just above the 100 day moving average (currently 1.1657) and was previously resistance. Regaining this zone as support would indicate a shift in longer term momentum.
From a volume perspective, we can see buying pressure increasing on test of support zones, while distribution is seen at resistance zones – a bearish divergence. The downward sloping 50 day moving average (currently 1.2939) is also bearish.
In summary, on the 4 hour timeframe the path of least resistance remains down as long as Resistance Zone 1 holds as resistance. A close above 1.24 would be the first sign of a potential trend reversal.
Support and Resistance Levels
| S / R Type | High | Low |
| Resistance Zone 1 | 1.2448 | 1.2177 |
| Resistance Zone 2 | 1.3862 | 1.3472 |
Fibonacci Retracement Levels
| 0.382 | 1.0779 |
| 0.50 | 1.0999 |
| 0.618 | 1.1217 |
| 0.786 | 1.1527 |
| 0.882 | 1.1705 |
Supply Zone
| Zone Number | High | Low |
| Supply Zone 1 | 1.1276 | 1.1034 |
| Supply Zone 2 | 1.1923 | 1.1609 |
Fair Value Gaps / Imbalances
| Gap Number | High | Low |
| Bearish FVG Zone 1 | 1.1609 | 1.1361 |
1 Hour Timeframe
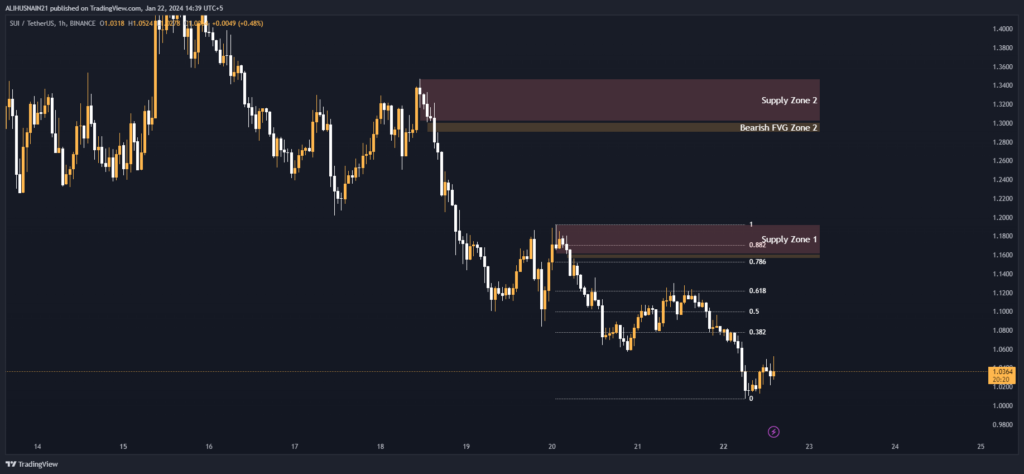
Zooming into the 1 hour chart, we can gain further insight into near term price action and levels:
Fair Value Gap Zone 1 (1.1609 – 1.1361): This bearish fair value gap (FVG) was formed after an extended bullish run failed to find acceptance at resistance. FVG zones often act as magnets and it will be interesting to see if price gets drawn back to fill this gap.
Fair Value Gap Zone 2 (1.3007 – 1.2902): A smaller bearish FVG near the 1.30 level that also corresponds to prior resistance. These gaps typically fill on continuation of the prevailing trend.
Supply Zone 1 (1.1923 – 1.1609): This supply zone was previously resistance on the 4 hour chart and will likely continue providing overhead pressure on rallies.
Supply Zone 2 (1.3472 – 1.3018): Zone 2 coincides with the .382 Fibonacci resistance and 10 day moving average. Strong resistance is probable in this area.
Fibonacci Retracement Levels: 0.382 at 1.0779, 0.50 at 1.0999, 0.618 at 1.1216, 0.786 at 1.1527 and the 0.882 level at 1.1704, are potential levels of interest on a bounce.
The short term momentum is clearly bearish as evidenced by the downward sloping 10, 25, and 50 day moving averages. Additionally, volume is drying up during consolidations and increasing on down moves – bearish continuation signal.
In summary, on the 1 hour timeframe, until bears lose control below 1.0779, further weakness targeting Fair Value Gap zones remains most probable. A convincing break above 1.1923 would negate the near term bearish outlook
Fibonacci Retracement Levels
| 0.382 | 1.0779 |
| 0.50 | 1.0999 |
| 0.618 | 1.1216 |
| 0.786 | 1.1527 |
| 0.882 | 1.1704 |
Supply Zone
| Zone Number | High | Low |
| Supply Zone 1 | 1.1923 | 1.1609 |
| Supply Zone 2 | 1.3472 | 1.3018 |
Fair Value Gaps / Imbalances
| Gap Number | High | Low |
| Bearish FVG Zone 1 | 1.1609 | 1.1560 |
| Bearish FVG Zone 2 | 1.3007 | 1.2902 |
The technical picture on both timeframes suggests the path of least resistance for Sui Network (SUI USDT) remains to the downside in the near future.
However, should we see increasing buying pressure materialize near support zones and a break back above key resistance points like 1.1924, it would indicate the current downtrend may be coming to an end.
Traders need to be mindful of potential bounces to sell into weakness or trade reversals if momentum shifts back in favor of the bulls. It will be important to follow how price action evolves around outlined demand zones and Fibonacci levels going forward.