The current price of SUI USDT is trading at 1.5198, down slightly (-1.47%) over the past 4 hours based on data from Binance. The daily trading volume has increased by 7.12% over the past 24 hours signaling increasing market participation.
The current market sentiment appears to be ranging between the key support and resistance levels.
4 Hour Timeframe
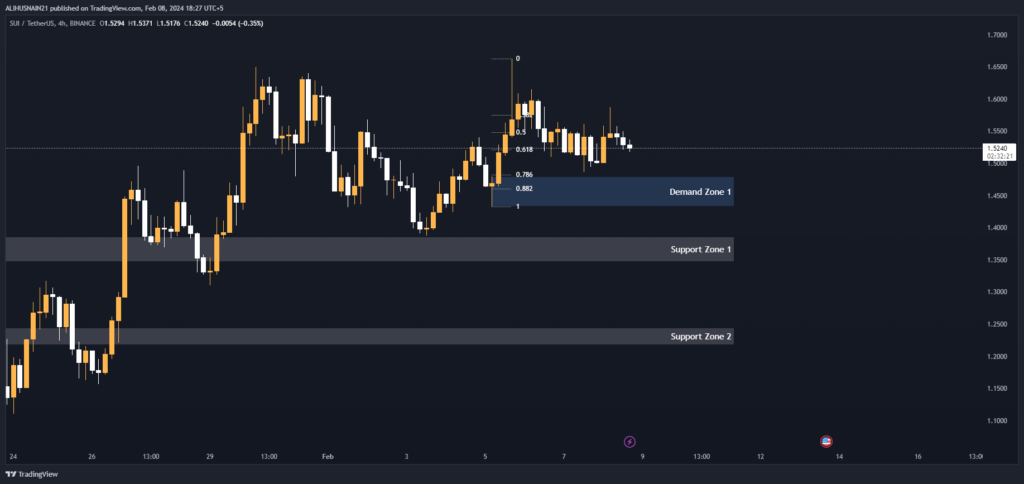
Let’s analyze the key support and resistance levels over the past few weeks on the 4 hour timeframe.
Support and Resistance Levels
The key support zones are 1.3862-1.3472 and 1.2448-1.2177. If price breaks below these levels it would signal a potential bearish continuation. Meanwhile resistance sits at the current price level around 1.5198.
A break above this could push price up to retest resistance at higher levels
| S / R Type | High | Low |
| Support Zone 1 | 1.3862 | 1.3472 |
| Support Zone 2 | 1.2448 | 1.2177 |
Fibonacci Retracement Levels
Looking at the Fibonacci retracement levels of the most recent swing high and low provides insight into potential reversal areas. Price is currently finding support around the 0.618 Fibonacci level of 1.5208.
This provides an important mid-term support level. A break below this level could see the price target the 0.786 level at 1.4822 and potentially lower levels of support. On the upside, resistance lies at the 0.382 level of 1.5751.
| 0.382 | 1.5751 |
| 0.50 | 1.5480 |
| 0.618 | 1.5208 |
| 0.786 | 1.4822 |
| 0.882 | 1.4601 |
Demand Zone
There is a key demand zone formed between 1.4794-1.4330 based on previous support/resistance flip levels. This provides an area of interest where increased buying pressure could fuel another uptrend.
| Zone Number | High | Low |
| Demand Zone 1 | 1.4794 | 1.4330 |