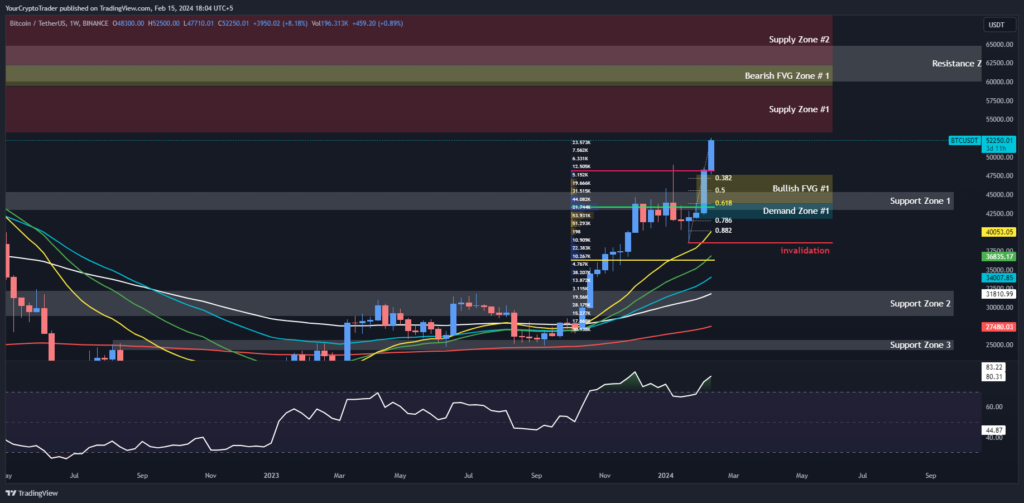
Bitcoin BTC USDT is carving out an important higher high above $52,000 against the Tether USDT. Support kicks in between $42,976-$43,882, with demand specifically at $43,308. Immediate resistance is in the $59,998.80-$64,854 zone.
Pullbacks towards Fib/EMA clusters between $40,200-$47,170 could present low-risk entry points. Holding the 100-week SMA at $38,555 maintains overall bullish control.
The current price of Bitcoin (BTC USDT) is sitting at $52,306.85 against the Tether USDT on the weekly timeframe. Let’s take a deeper look at some key technical levels that may provide insight into Bitcoin’s potential near-term price action.
Bitcoin (BTC USDT) Support Levels
Bitcoin (BTC USDT) has established four distinct support zones based on previous price action. The strongest support is found between $42,976- $44,400, as this zone encapsulates multiple weekly lows.
Breaking below this level could open the door for a move lower towards the $32,259.90-$28,850 support zone. Additional layered support exists at $24,309.38-$25,722.92 and $17,622-$15,628.29.
BTC USDT price will need to break below all four support levels to shift the bias more bearish over the long run.
| Support Zone Number | Price High | Price Low |
| Support Zone 1 | 45400.00 | 42976.00 |
| Support Zone 2 | 32259.90 | 28850.00 |
| Support Zone 3 | 24309.38 | 25722.92 |
| Support Zone 4 | 17622.00 | 15628.29 |
Bitcoin (BTC USDT) Resistance Levels
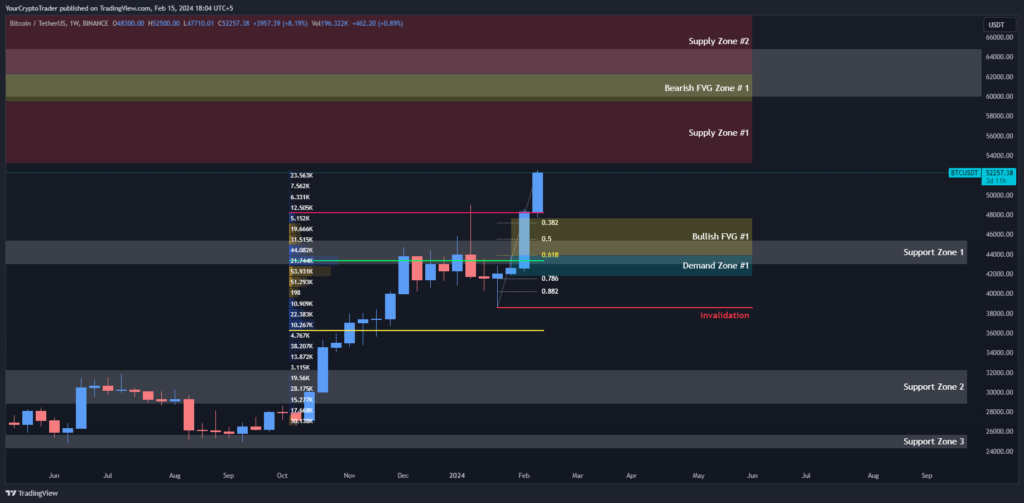
On the upside, Bitcoin (BTC USDT) faces immediate resistance within the $59,998.80-$64,854 zone. This level marks the lower bounds of the current trading range. A weekly close above here would imply the start of a new uptrend.
| Resistance Zone Number | Price High | Price Low |
| Resistance Zone | 59998.80 | 64854.00 |
Bitcoin (BTC USDT) Fibonacci Retracement Levels
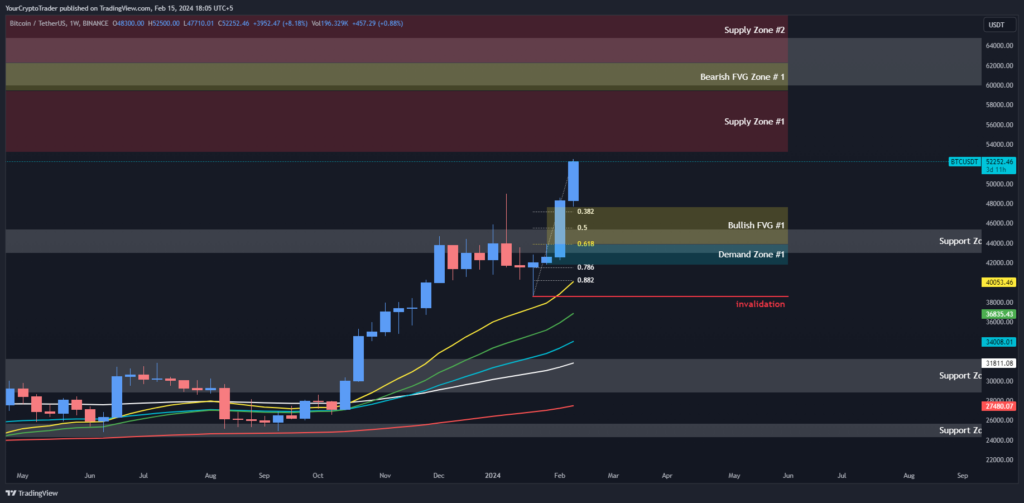
By measuring the most recent major swing high to low, we can identify some key Fibonacci retracement levels. The 0.382, 0.50, 0.618 and 0.786 levels fall between $40,201.52 – $47,168.68.
Pullbacks towards these levels could represent attractive entry points, with the 0.618 level at $43,896.41 potentially offering the best risk/reward.
| Fib Retracement Value | Price |
| 0.382 Fib Level | 47168.68 |
| 0.50 Fib Level | 45527.11 |
| 0.618 Fib Level | 43896.41 |
| 0.786 Fib Level | 41542.78 |
| 0.882 Fib Level | 40201.52 |
Bitcoin (BTC USDT) Supply Zones
Supply zones indicate where selling pressure may emerge on an increase in volume. The $53,256.64-$59,444 zone is the first major supply barrier based on peaks from earlier in 2022.
Stronger resistance exists at $62,278-$69,000, as this encompasses the all-time high price.
| Supply Zone Number | Price High | Price Low |
| Supply Zone 1 | 53256.64 | 59444.00 |
| Supply Zone 2 | 62278.00 | 69000.00 |
Bitcoin (BTC USDT) Demand Zones
Demand zones represent areas where buying support may emerge on an increase in volume. Presently, the $41,804.88-$43,882.36 zone is the sole demand area of note based on a cluster of lows from the start of this month January 2024.
| Demand Zone Number | Price High | Price Low |
| Demand Zone 1 | 43882.36 | 41804.88 |
Bitcoin (BTC USDT) Fair Value Gaps / Imbalances (FVG)
Fair value gaps (FVG) refer to spaces on the chart where no prior price action exists. The $43,882.36-$47,710.01 region denotes a bullish FVG zone, while the $59,444-$62,278 area highlights a bearish gap. Closure of these zones could spark notable price moves.
| FVG Zone Type & Number | Price High | Price Low |
| Bullish FVG Zone | 43882.36 | 47710.01 |
| Bearish FVG Zone | 62278.00 | 59444.00 |
Exponential Moving Averages (EMA) Levels on Bitcoin (BTC USDT)
The 21, 34, 55 and 100 EMAs are slowly trending higher, with price holding well above them all. This maintains the bullish bias. A weekly close below the 200 EMA at $27,480 would shift momentum more neutral.
| 200 EMA (Red Color) | 27480.01 |
| 100 EMA (White Color) | 31810.35 |
| 55 EMA (Blue Color) | 34006.06 |
| 34 EMA (Green Color) | 36832.20 |
| 21 EMA (Yellow Color) | 40048.49 |
Fixed Range Volume Profile Levels applied on Bitcoin (BTC USDT)
Looking at volume profile shows the Point of Control (POC) is at $43,308.78. This coincides tightly with demand zone support and the 0.618 Fib retracement level. The Value Area High (VAH) of $48,235.76 and Value Area Low (VAL) at $36,351.98 form a fairly wide range.
| Point of Control (POC) | Value Area High (VAH) | Value Area Low (VAL) |
| 43308.78 | 48235.76 | 36351.98 |
Invalidation Levels for Bitcoin (BTC USDT)
For the bullish outlook to remain intact, Bitcoin (BTC USDT) must hold above the 100-week SMA at $38,555 on a weekly closing basis. Otherwise, the path of least resistance would likely shift lower.
| Invalidation Type (Long, Short) | Invalidation Price |
| Long | 38555.00 |
Relative Strength Index (RSI) Levels for Bitcoin (BTC USDT)
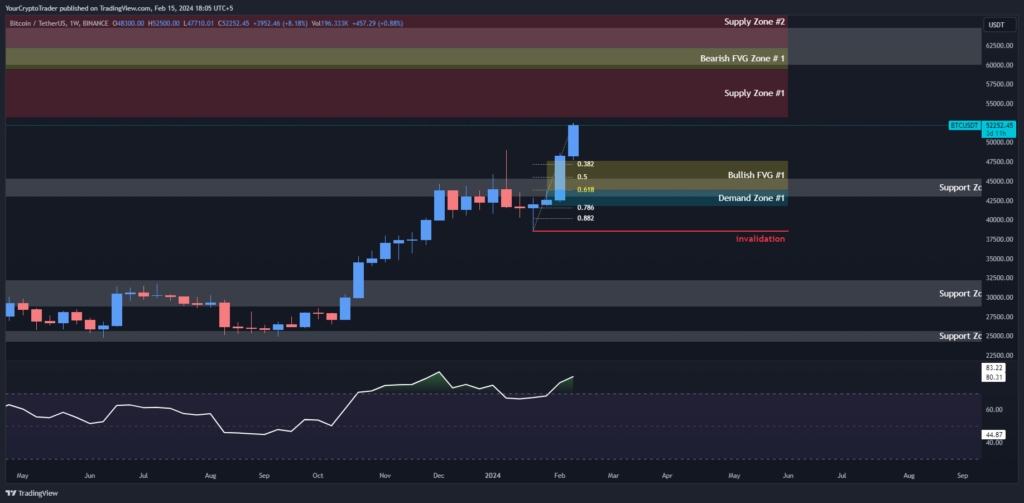
The RSI sits at an elevated 80.72, approaching overbought territory near 90. This adds to the risk of a pullback developing in the short-run. Yet, as long as key support floors hold, the RSI could simply consolidate sideways within an uptrend.
Current RSI Level: 80.72