Current Price and Market Structure As of writing, the current price of ENS USDT is trading at $21.08, positioning it between the first resistance zone of $21.90 – $21.17 and the underlying demand zone of $20.30 – $19.61.
On the 4-hour timeframe and 1-hour timeframe, we can observe the following levels of support and resistance for ENS USDT.
4 Hour Timeframe
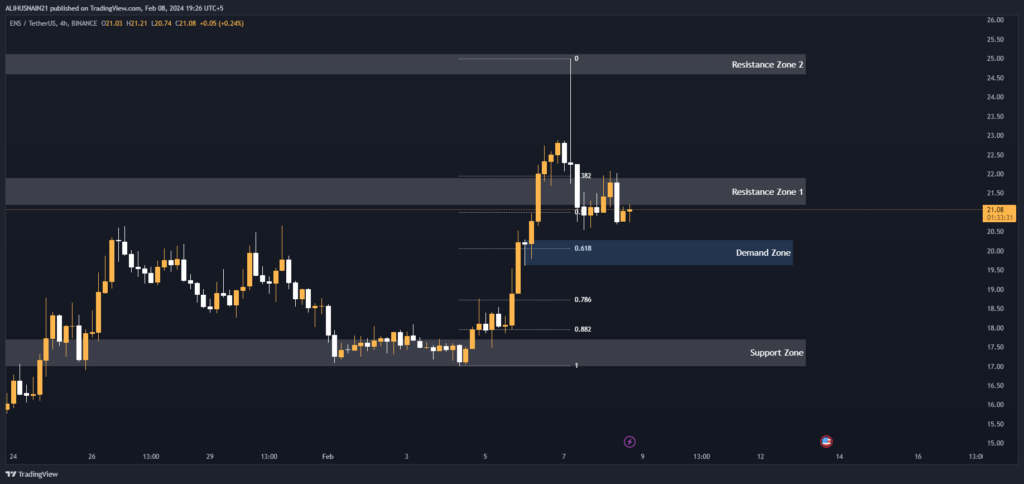
On the 4-hour timeframe ENS USDT is showing signs of continued upside potential as long as the current consolidation range holds. A decisive break of major support levels, however, could signal a change in the market’s short-term trend.
It will be important for traders to stay flexible in their analysis and adjust strategies according to price action.
Support and Resistance Levels
These zones were determined by analyzing recent price action and identifying common areas where the price found support or struggled to break through. Below the current support zone, we find a demand zone centered around $20.30 – $19.61.
| S / R Type | High | Low |
| Support Zone | 17.72 | 16.99 |
| Resistance Zone 1 | 21.90 | 21.17 |
| Resistance Zone 2 | 25.12 | 24.57 |
Fibonacci Retracement Levels
To quantify potential pullback levels, we can employ Fibonacci retracement drawn from the most recent swing high to low. The key retracement ratios are as follows:
0.382: $21.95 0.50: $21.01 0.618: $20.07 0.786: $18.73 0.882: $17.97
This retracement analysis complements the support/resistance zones in identifying potential barriers the price may face on a short-term pullback. In particular, the 0.382, 0.50 and 0.618 levels align closely with identified resistance and demand zones.
| 0.382 | 21.95 |
| 0.50 | 21.01 |
| 0.618 | 20.07 |
| 0.786 | 18.73 |
| 0.882 | 17.97 |
Demand Zone
| Zone Number | High | Low |
| Demand Zone | 20.30 | 19.61 |
1 Hour Timeframe
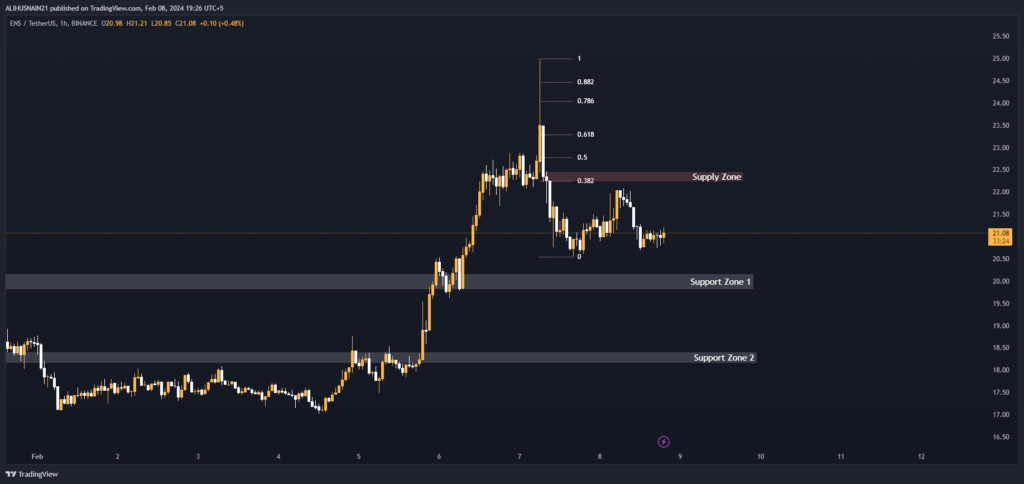
The current price of ENS USDT on the 1-hour timeframe is 21.08. Let us analyze the price action and levels of support and resistance surrounding this current price level.
Support and Resistance Levels
By analyzing the recent price action and swings on the 1-hour chart, we can identify two key zones of support and resistance. These are outlined in the table below.
The nearest support zone is between 20.17-19.80. This zone encompasses recent swing lows in the price action. Below this, stronger support lies between 18.41-18.15.
| S / R Type | High | Low |
| Support Zone 1 | 20.17 | 19.80 |
| Support Zone 2 | 18.41 | 18.15 |
Fibonacci Retracement Levels
To identify additional potential price reversal areas, we can apply Fibonacci retracement levels from the most recent swing high to low. These retracement levels act as price magnets that the market often reacts to.
This shows us areas of potential resistance at 22.25, 22.77, 23.30 and so on if the market attempts an upward retracement from the current swing low.
| 0.382 | 22.25 |
| 0.50 | 22.77 |
| 0.618 | 23.30 |
| 0.786 | 24.05 |
| 0.882 | 24.47 |
Supply Zone
Analyzing the recent break of an ascending trendline, we can identify an area that may now act as a supply zone going forward. This is the zone the price previously found support at but has since broken below.
This supply zone will act as a key resistance level if price attempts to rise back above this zone in the short term.
| Zone Number | High | Low |
| Supply Zone | 22.46 | 22.23 |