The current price of ICP USDT stands at $12.397. Let’s take a look at some key areas of interest, resistance zones and Fibonacci retracement levels above may cap further gains for ICP USDT in the near term.
Meanwhile, demand areas below like the supply zone and FVG provide support. The overall structure remains bullish as long as the support zone holds.
4 Hour Timeframe
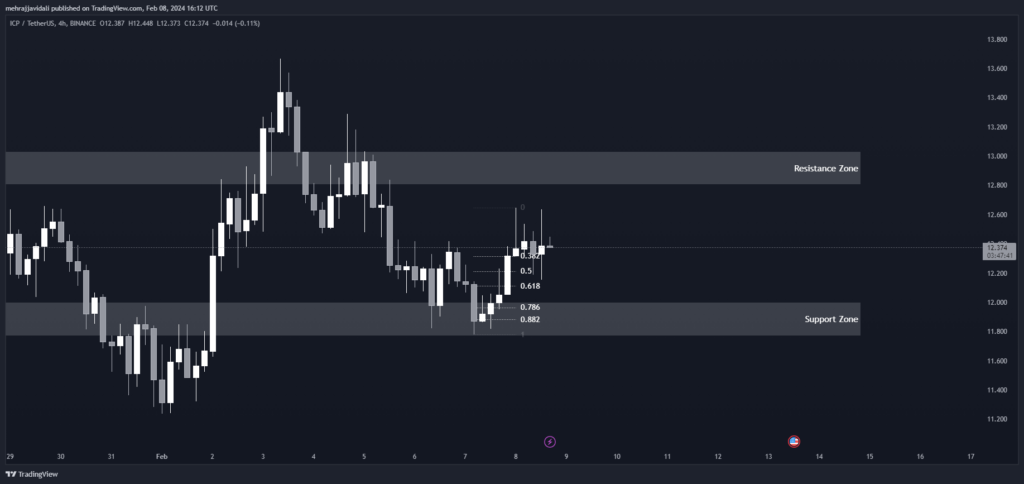
Support and Resistance Levels
We can see a key resistance area formed between $13.033 and $12.803. A break above this zone could indicate further upside potential.
| S / R Type | High | Low |
| Resistance Zone | 13.033 | 12.803 |
Fibonacci Retracement Levels
The 0.382, 0.50 and 0.618 levels fall between $12.315 and $12.113. These will likely provide resistance if tested.
| 0.382 | 12.315 |
| 0.50 | 12.214 |
| 0.618 | 12.113 |
| 0.786 | 11.965 |
| 0.882 | 11.883 |
Supply Zone
The highlighted supply zone sits from $12.000 to $11.769. This area may see increased selling pressure if reached.
| Zone Number | High | Low |
| Support Zone | 12.000 | 11.769 |
1 Hour Timeframe
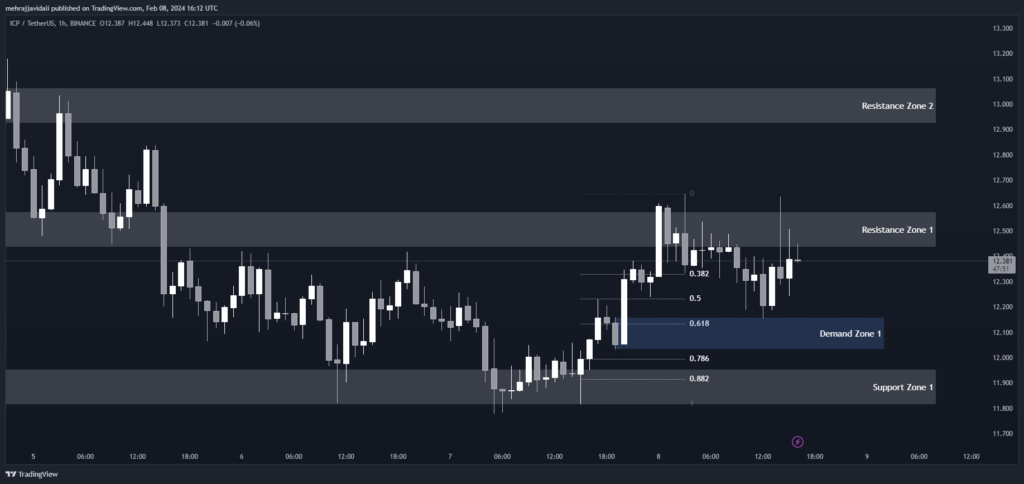
The current price of ICP USDT is between the 0.382 and 0.50 Fib retracement levels within the upper range of the identified demand zone. Support lies below, with resistance above. A breakdown of support or push through resistance may signal the next moves for ICP USDT. Traders should be mindful of these defined levels on the 1 hour chart.
Support and Resistance Levels
The first support zone sits between 11.955-11.813. If price moves below this, further downside is possible.Resistance zone 1 is from 12.576-12.434. Breaking above this could push price higher.Resistance zone 2 ranges from 13.065-12.923.
| S / R Type | High | Low |
| Support Zone 1 | 11.955 | 11.813 |
| Resistance Zone 1 | 12.576 | 12.434 |
| Resistance Zone 2 | 13.065 | 12.923 |
Fibonacci Retracement Levels
The 0.382 Fib level provides support at 12.330.0.50 Fib level is at 12.233.0.618 Fib level is 12.133.Additional support may be found at the 0.786 and 0.882 Fib levels.
| 0.382 | 12.330 |
| 0.50 | 12.233 |
| 0.618 | 12.133 |
| 0.786 | 11.995 |
| 0.882 | 11.916 |
Demand Zone
Demand zone 1 is spotted between 12.160-12.032. If price falls to this zone, it could see buying pressure.
| Zone Number | High | Low |
| Demand Zone 1 | 12.160 | 12.032 |