In this technical analysis, we will take an in-depth look at the XAI USDT trading pair on the 4 hour and 1 hour timeframe. We will identify key resistance and support levels, analyze Fibonacci retracement levels, and examine demand zones that could provide buying opportunities.
By understanding these various technical indicators, we aim to determine the overall trend and potential entry and exit points for trading XAI USDT.
4 Hour Timeframe
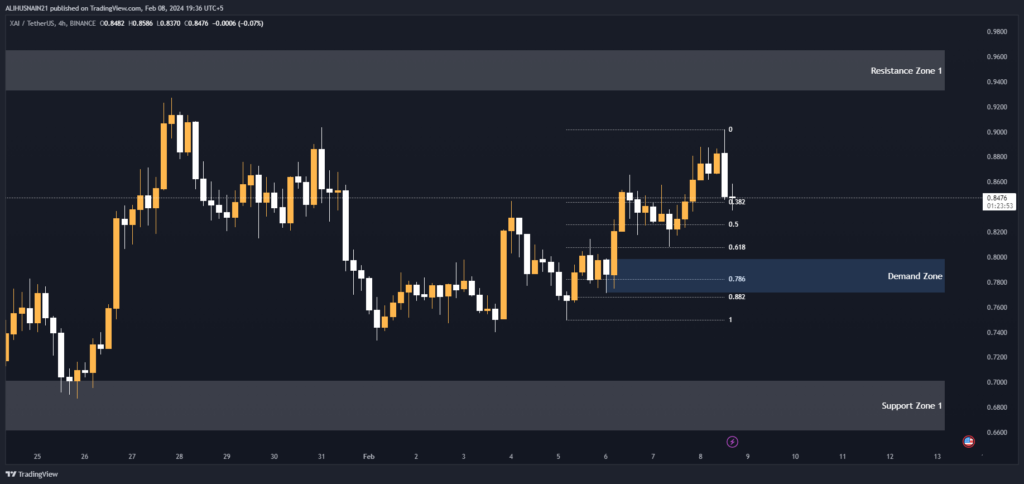
XAI USDT is currently in a downtrend on the 4 hour chart. Key technical levels have been identified to watch for potential reversal signals or continuation of the bearish move. The demand zone between 0.7989-0.7711 and support zone 1 near 0.7015 provide areas where buying interest may come back in.
A hold of either could present low-risk entry opportunities, while a breakthrough of resistance zone 1 is required to invalidate the current bearish bias. Monitoring price action around these levels will provide clues on whether this cryptocurrency pair is ready to change direction or has further downside left.
Support and Resistance Levels
The first step is to identify significant resistance and support zones. As seen in the table above, the key resistance zone sits between 0.9654 and 0.9326. Breaking above this area could indicate the start of an uptrend.
Below that sits support zone 1 from 0.7015 to 0.6613. A breakdown below support would imply more downside is likely.
| S / R Type | High | Low |
| Resistance Zone 1 | 0.9654 | 0.9326 |
| Support Zone 1 | 0.7015 | 0.6613 |
Fibonacci Retracement Levels
Next, we apply Fibonacci retracement to the most recent swing high and low. This uses key Fibonacci ratios to predict where pullbacks may find support or resistance. As shown above, the 0.382, 0.50, 0.618, 0.786 and 0.882 levels all provide potential areas that could stop a retracement or bounce.
Of particular interest is the 0.618 level at 0.8078, which often acts as strong support during corrections.
| 0.382 | 0.8438 |
| 0.50 | 0.8260 |
| 0.618 | 0.8078 |
| 0.786 | 0.7823 |
| 0.882 | 0.7677 |
Demand Zone
Demand zones represent areas of previous buying interest that may hold again. Currently, a demand zone sits between 0.7989 and 0.7711. If price pulls back to this range, it could present a buying opportunity.
Traders would watch for indications like higher lows or candlestick reversal patterns to signal bids are overwhelming offers in this zone. Defending this area would imply the overall downtrend may be ending.
| Zone Number | High | Low |
| Demand Zone | 0.7989 | 0.7711 |
1 Hour Timeframe
Support and Resistance Levels
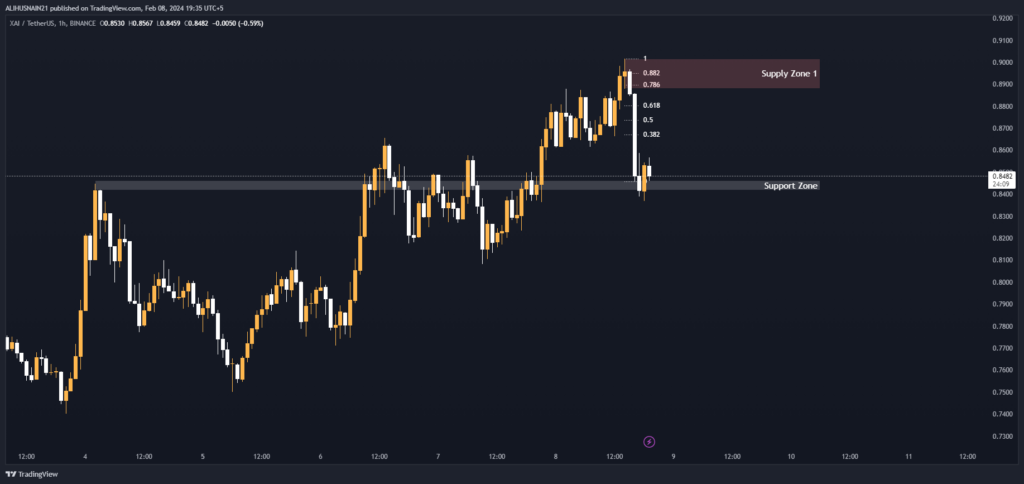
The current price of XAI USDT is 0.8507. Looking at recent price action, we can identify the following key support and resistance levels on the 1-hour chart:
- Support zone: Between 0.8463 and 0.8416. Price found support in this zone during the previous session and bounced upwards from here. This makes it a crucial near-term support level.
- Supply zone 1: Between 0.9017 and 0.8880. This zone halted the upside move previously. If price breaks above this supply zone, it could see further upside momentum.
| S / R Type | High | Low |
| Support Zone | 0.8463 | 0.8416 |
Fibonacci Retracement Levels
Fibonacci retracement levels provide traders with potential reversal areas based on important Fibonacci ratios. The key Fibonacci retracement levels for XAI USDT are:
- 0.382 (0.8671)
- 0.50 (0.8736)
- 0.618 (0.8804)
- 0.786 (0.8898)
- 0.882 (0.8951)
If the current downtrend loses momentum, we could see price retrace to one of these Fibonacci levels before resuming the prior downward move. The 0.618 and 0.50 levels will act as strong resistance.
| 0.382 | 0.8671 |
| 0.50 | 0.8736 |
| 0.618 | 0.8804 |
| 0.786 | 0.8898 |
| 0.882 | 0.8951 |
Supply Zone
| Zone Number | High | Low |
| Supply Zone 1 | 0.9017 | 0.8880 |